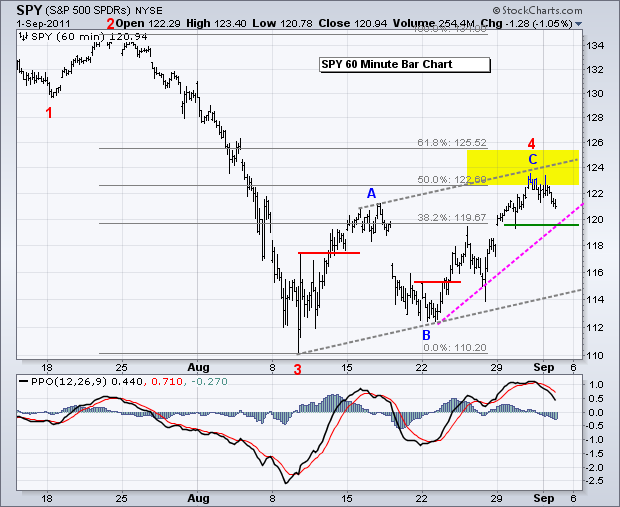
After an ISM pop in the morning, stocks were hit with a dose of selling pressure and closed weak. Even though the ISM Index was better-than-expected, it was still weak overall and at a two year low. Anything above 50 indicates expansion, but a reading of 50.6 indicates little expansion. Also note that jobless claims remained above 400,000 and Eurozone manufacturing contracted for the first time in two years. Why am I covering these economic stats? First, it was these stats that triggered the selloff in July-August. Second, these stats did little to counter the negative economic news in July. Third, and most important, the market reacted negatively to news. This negative reaction is, well, negative. On the price chart, the script for a peak in the 123-125 area is working out quite well for SPY. After edging above the 50% retracement and into the resistance zone the last few days, the ETF declined on Thursday with a weak close. There are three clear swings since mid August (ABC). The first bearish signal would be a reversal of the current upswing (wave C). I am marking swing support at 119.50 now. A move below this level would break the pink trendline extending up from the wave B low and likely push the PPO into negative territory.


Betting against Treasuries (and gold) is a dangerous bet these days. Resilience in the 20+ year Bond ETF (TLT), weakness in stocks and poor economic numbers are prompting me to re-label this wave count. Perhaps the mid August peak marks the end of Wave 3 and the late August pullback is a Wave 4 correction. This means Wave 5 up is about to begin, which would be bearish for stocks. Key support is set at 106. A move below this level would negate this count and argue for further weakness.

A breakout in the US Dollar Fund (UUP) is another reason to be negative on stocks and positive on bonds. With Eurozone manufacturing contracting, the odds of a rate hike at the ECB are pretty much zero. Over the past month, the ECB has moved from hawkish to dovish, which will put downward pressure on EU rates and possibly the Euro. This is greenback positive. UUP broke above resistance with a pretty good surge the last few days.

The 12-Month US Oil Fund (USL) stalled around 40, just as the stock market stalled. It looks like horizontal resistance from the mid August high is coming into play. The swing remains up with swing support marked at 38.90.

The Dollar is breaking out and the Gold SPDR (GLD) is holding strong. Euro money may be moving into bullion as a safe-haven. On the price chart, GLD formed a pennant over the last few days. A break above pennant resistance signals a continuation higher with the August highs as a target.

Key Economic Reports:
Fri - Sep 02 - 08:30 - Employment Report - Nonfarm Payrolls
Charts of Interest: Tuesday and Thursday in separate post.
This commentary and charts-of-interest are designed to stimulate thinking. This analysis is not a recommendation to buy, sell, hold or sell short any security (stock ETF or otherwise). We all need to think for ourselves when it comes to trading our own accounts. First, it is the only way to really learn. Second, we are the only ones responsible for our decisions. Think of these charts as food for further analysis. Before making a trade, it is important to have a plan. Plan the trade and trade the plan. Among other things, this includes setting a trigger level, a target area and a stop-loss level. It is also important to plan for three possible price movements: advance, decline or sideways. Have a plan for all three scenarios BEFORE making the trade. Consider possible holding times. And finally, look at overall market conditions and sector/industry performance.

