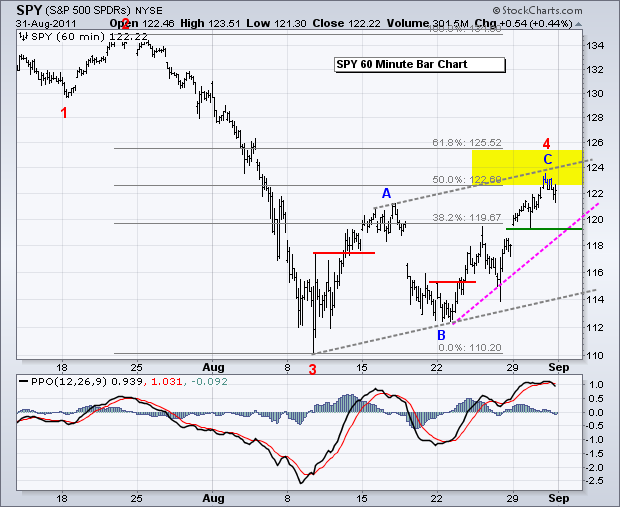
The bulls weakened a bit on Wednesday, but stocks still managed gains overall. There were pockets of weakness with the Russell 2000 ETF (IWM) and Technology ETF (XLK) edging lower. The Finance SPDR (XLF) continued its run with a 1.29% gain to lead all sectors. Semis were under pressure during the session and after the close as Novellus (NVLS) cut its third quarter revenue projections based on weakening PC demand. Blame it on those tablets! It is hard to compete with a saturated tablet market and HP offering another round of $100 tablets. The price charts for the major index ETFs are basically unchanged. SPY edged above its 50% retracement and into the resistance zone. The bulls are on thin ice with SPY trading in this area. There are three clear swings since mid August (ABC). The first bearish signal will be a reversal of the current upswing (wave C). I am marking swing support at 119.20. A move below this level would break this week's low and the pink trendline extending up from the wave B low.
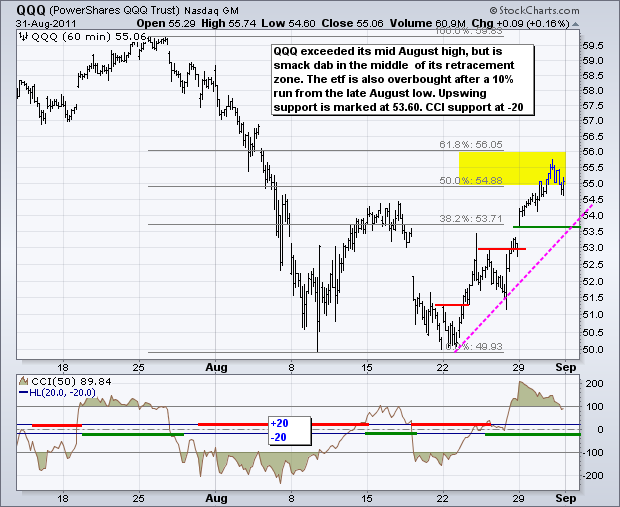
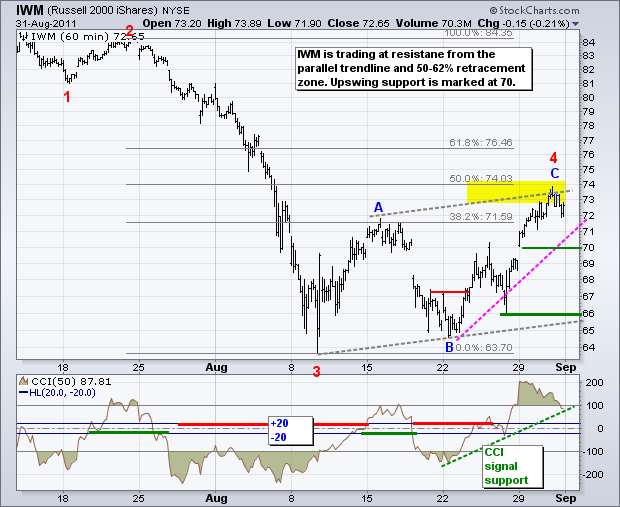
There could still be some fireworks this week and next. First, the week before Labor Day and the first few days after Labor Day are traditionally bullish(Stock Traders Almanac). However, September is traditionally the weakest month. Therefore, we have a changing of the seasonal patterns sometime in early September. Before next week arrives, we still have some big economic reports on Thursday (ISM, Jobless Claims) and Friday (Employment Report).
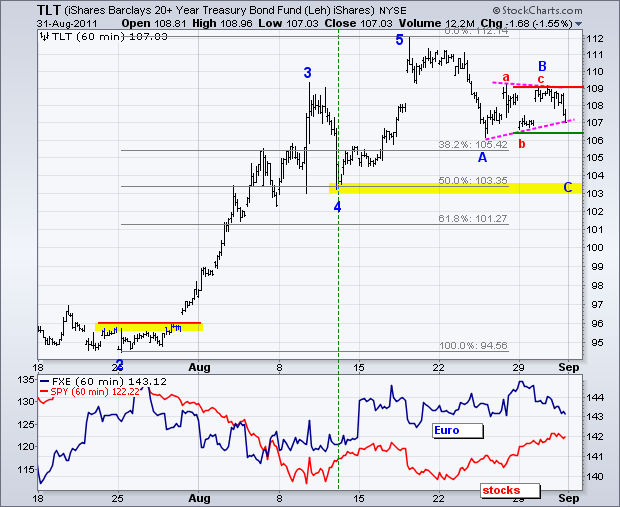
The 20+ year Bond ETF (TLT) dipped back to 107 to affirm the current pennant formation. While this is usually a continuation pattern, pennants can break either way. A lot will depend on the economic reports today and tomorrow as well as expectations for QE3. It is still possible that an ABC correction is taking shape, but the bears are going to need some help from the economic reports and stock market in the next two days. Positive economic reports and further gains in stocks would be bearish for bonds. The current pennant looks like a smaller abc corrective pattern that forms the bigger wave B. A break below Monday's low would signal a continuation lower for wave C. Negative economic reports and weakness in stocks would be bullish for bonds.
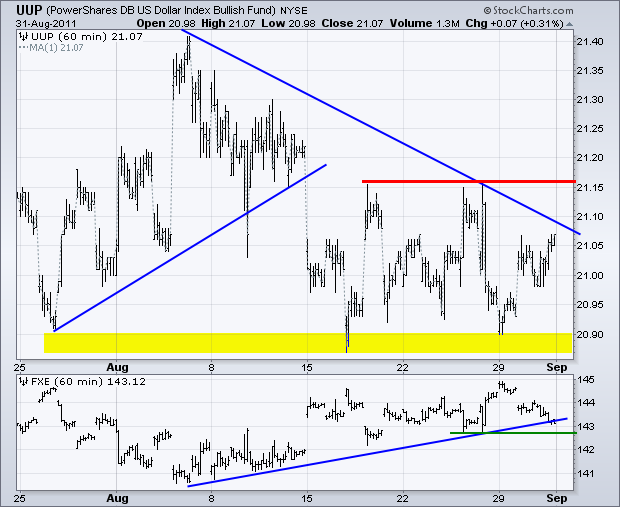
The US Dollar Fund (UUP) is showing some resilience with a surge off support and further gains on Wednesday. Overall, UUP remains stuck in a trading range with the late August highs marking resistance and the mid August low marking support. Movements in UUP are dependent on the Euro. The Euro Currency Trust (FXE) failed at 145 resistance and declined sharply on Thursday. This could be the start of a Euro downswing that would be Dollar bullish.
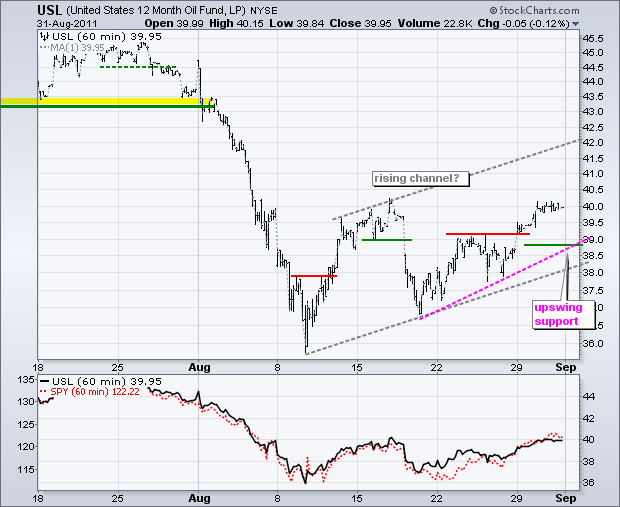
The 12-Month US Oil Fund (USL) stalled around 40, just as the stock market stalled. USL remains in a potential rising channel with a target at the upper trendline. However, it looks like horizontal resistance from the mid August high is coming into play. The swing remains up with swing support marked at 38.90.
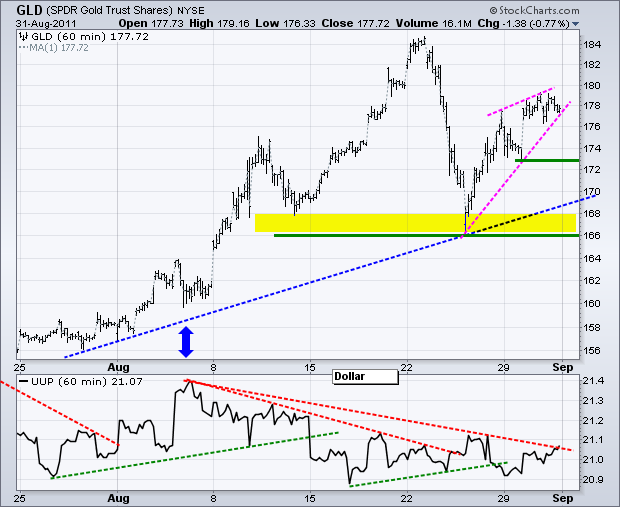
The inverse relationship between gold and the Dollar is a bit strained, but remains in place overall. The blue arrows at August 4th mark the start of a decline in the Dollar and rise in gold. The Dollar has since been firming and trying to forge a reversal. A breakout in the greenback could give way to weakness in gold. For now, this week's low marks first support for bullion.
Key Economic Reports:
Wed - Aug 31 - 07:30 - Challenger Job Cuts
Wed - Aug 31 - 08:15 - ADP Employment
Wed - Aug 31 - 09:45 - Chicago PMI
Wed - Aug 31 - 10:00 - Factory Orders
Wed - Aug 31 - 10:30 - Oil Inventories
Thu - Sep 01 - 08:30 - Jobless Claims
Thu - Sep 01 - 10:00 - ISM Index
Thu - Sep 01 - 10:00 - Construction Spending
Thu - Sep 01 - 15:00 - Auto-Truck Sales
Fri - Sep 02 - 08:30 - Employment Report - Nonfarm Payrolls
Charts of Interest: Tuesday and Thursday in separate post.
This commentary and charts-of-interest are designed to stimulate thinking. This analysis is not a recommendation to buy, sell, hold or sell short any security (stock ETF or otherwise). We all need to think for ourselves when it comes to trading our own accounts. First, it is the only way to really learn. Second, we are the only ones responsible for our decisions. Think of these charts as food for further analysis. Before making a trade, it is important to have a plan. Plan the trade and trade the plan. Among other things, this includes setting a trigger level, a target area and a stop-loss level. It is also important to plan for three possible price movements: advance, decline or sideways. Have a plan for all three scenarios BEFORE making the trade. Consider possible holding times. And finally, look at overall market conditions and sector/industry performance.

