Art's Charts December 30, 2011 at 07:19 AM
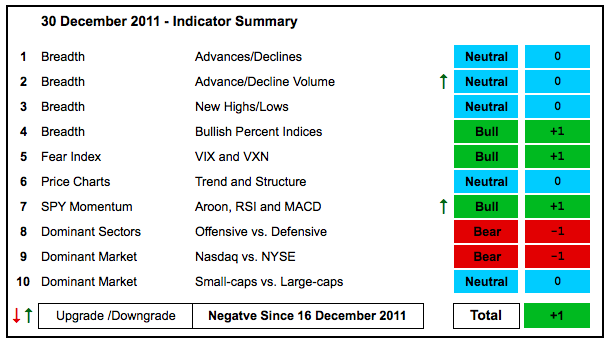
With a couple of upgrades, the indicator summary moved from -2 to +1 this week. The total has been waffling around the zero level for a few weeks now, which reflects a divided the market... Read More
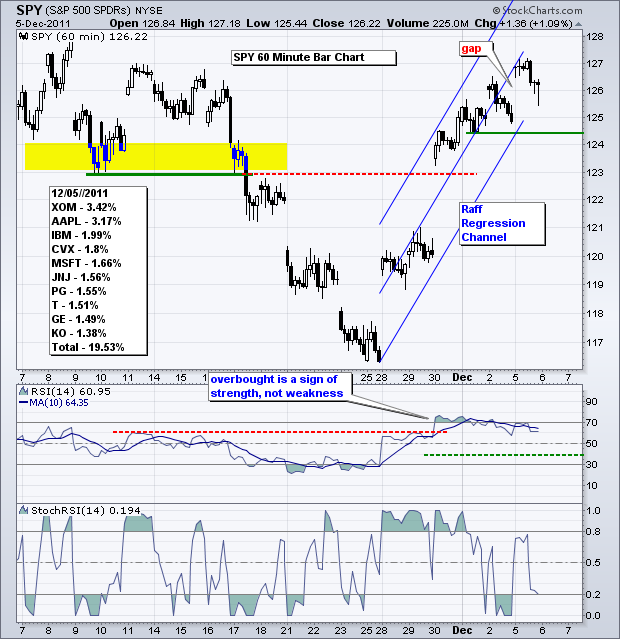
Art's Charts December 30, 2011 at 05:58 AM
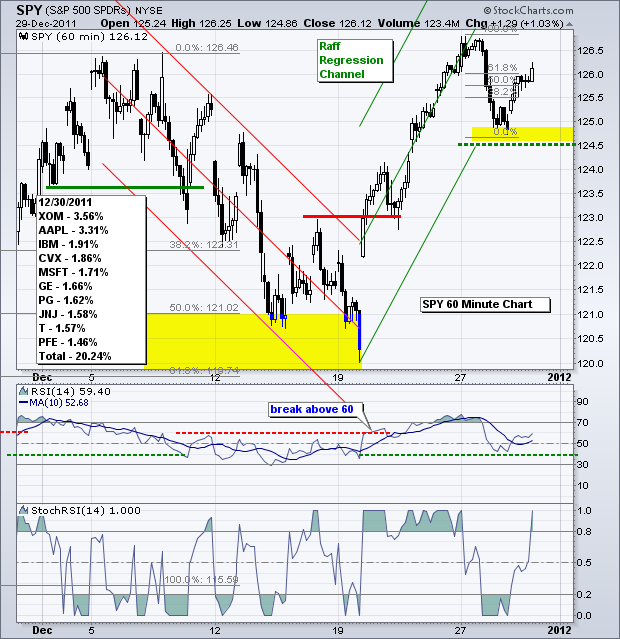
Stocks continued their short-term uptrends with further strength on Tuesday and then fell sharply on Wednesday. This decline was not enough to reverse the short-term uptrend... Read More
Art's Charts December 23, 2011 at 06:36 AM

Even though the indicator summary remains unchanged this week, there was some strengthening under the hood this week. Notably the NYSE Net New Highs Line continues to rise and shows no signs of weakness... Read More
Art's Charts December 23, 2011 at 05:09 AM
First, note that Art's Charts will not be published next Monday through Thursday. It is a fine time for family and Christmas. Commentary will resume on Friday, December 30th. Merry Christmas and Happy Holidays from all of us at Stockcharts.com... Read More
Art's Charts December 22, 2011 at 05:06 AM
An earnings miss from Oracle hit the Nasdaq 100 ETF (QQQ) hard, but the broader market held up pretty well as the S&P 500 ETF (SPY) finished the day with a slight gain... Read More
Art's Charts December 22, 2011 at 05:00 AM
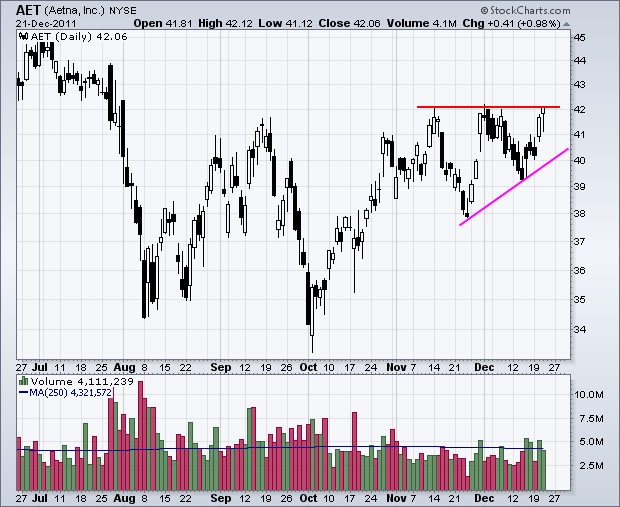
ATVI Forms Harami at Support. NYB Edges High on Expanding Volume. T Breaks Flag Resistance after Failed Deal. Plus AET, HST, MET, PBCT and PGR. This commentary and charts-of-interest are designed to stimulate thinking... Read More
Art's Charts December 21, 2011 at 04:19 AM
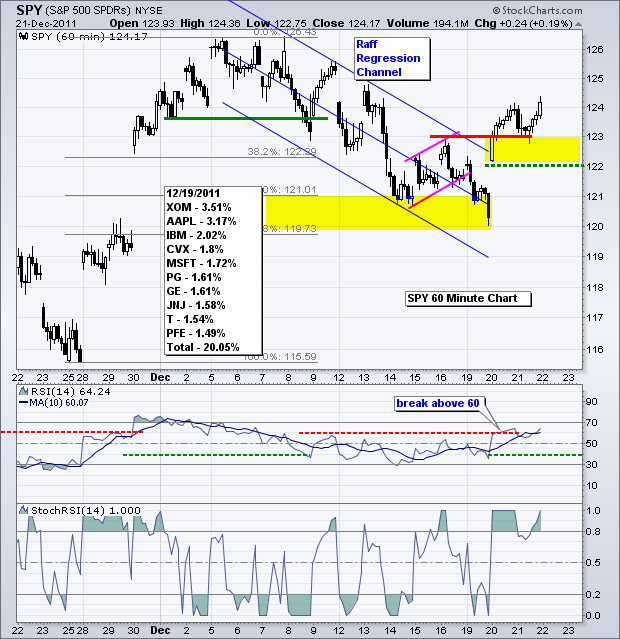
The European Central Bank (ECB) is opening the monetary floodgates today. While they may not call it quantitative easing (QE) by name, the ECB is essentially giving money to European banks so they can stimulate the economy with increased lending. Seems I've heard this one before... Read More
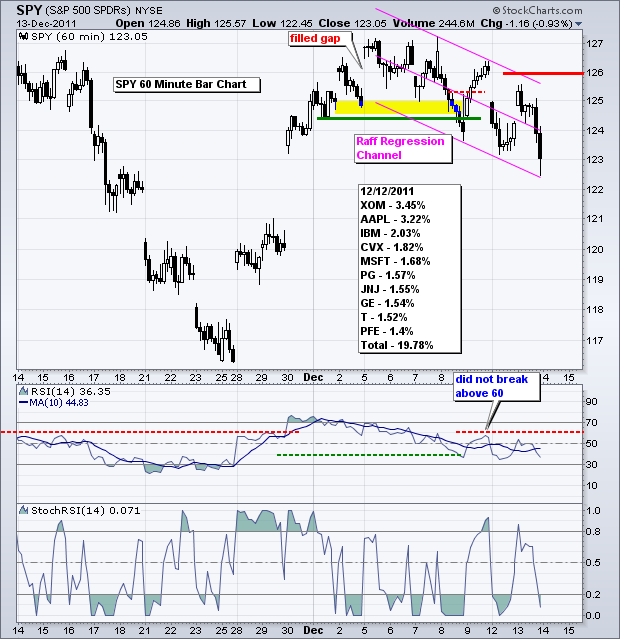
Art's Charts December 20, 2011 at 05:45 AM
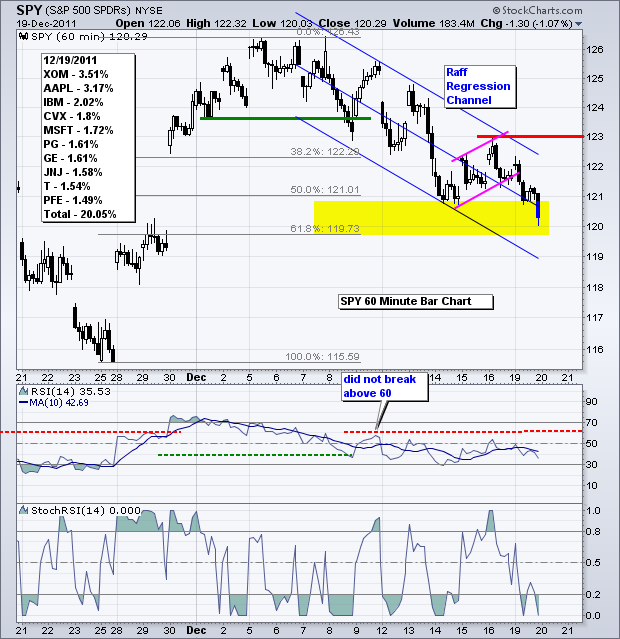
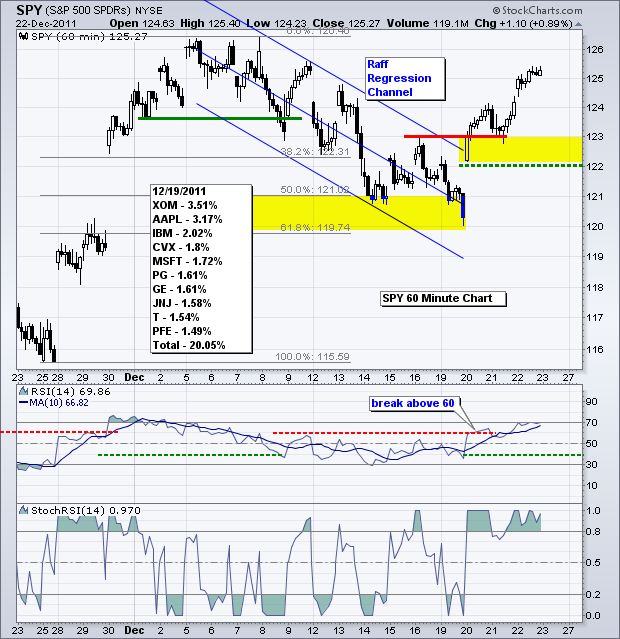
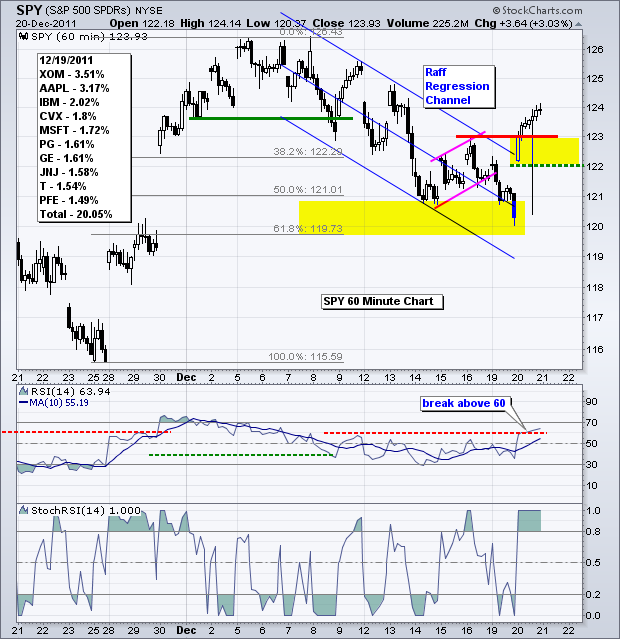
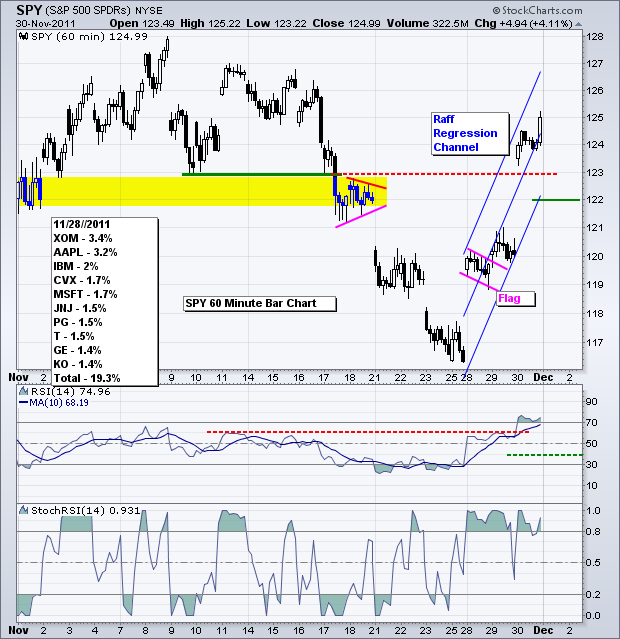
Now that everyone has officially given up on the Santa Claus rally and stocks are oversold, perhaps we will get that rally. The S&P 500 ETF (SPY) remains in a falling price channel that is defined by the Raff Regression Channel. Key resistance is set at 123... Read More
Art's Charts December 20, 2011 at 05:40 AM
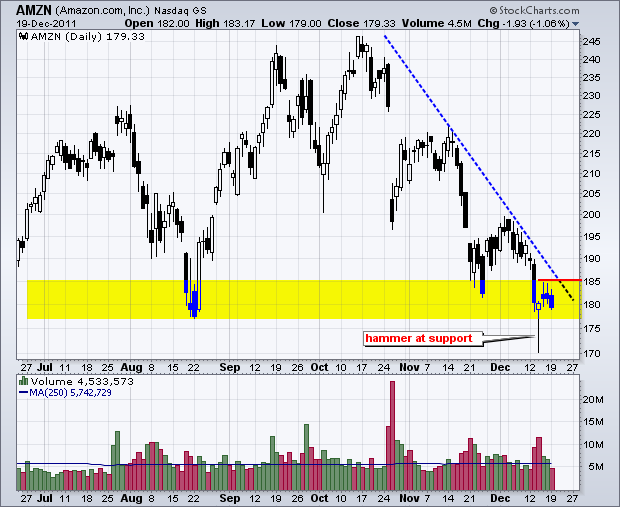
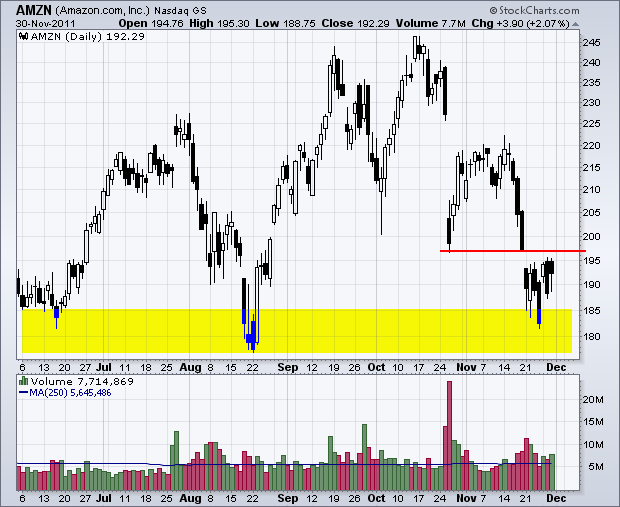
AMZN Forms Big Hammer at Support. CCL Traces out Big Bearish Engulfing. DE Declines Six Days Straight. Plus $AN, $APOL, D, DE, FSIV, MXIM This commentary and charts-of-interest are designed to stimulate thinking... Read More
Art's Charts December 19, 2011 at 03:20 AM
I am taking a day off of the commentary today, but the charts have been updated and posted below. Art's Charts will return in full on Tuesday... Read More
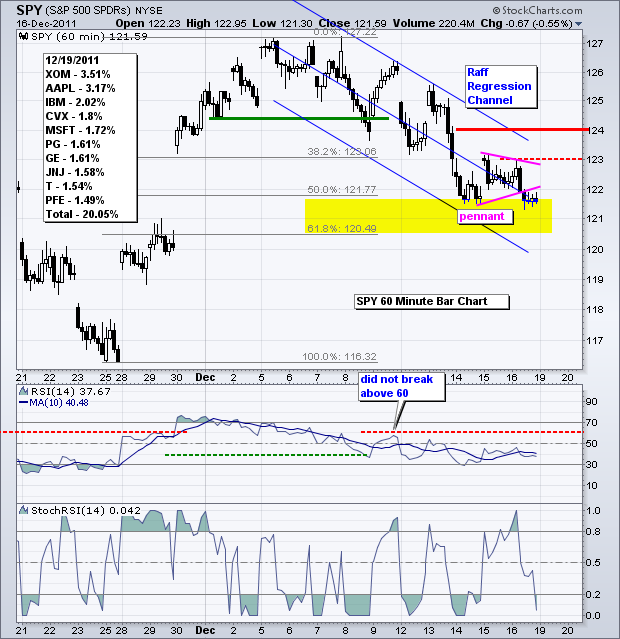
Art's Charts December 16, 2011 at 05:44 AM
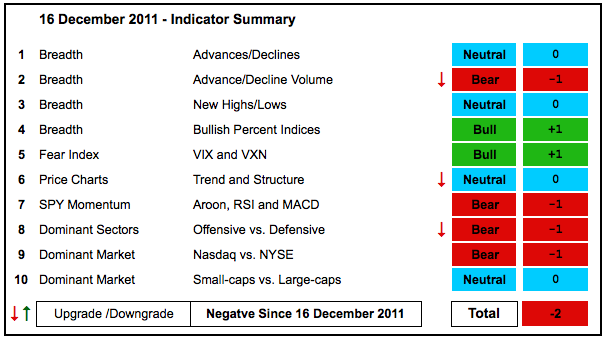
The market is about as mixed up as it can be right now. With a few downgrades this week, the indicator summary flipped back to negative territory (-2). There are still a few neutral readings out there that could go either way with a significant move... Read More
Art's Charts December 16, 2011 at 04:35 AM
Stocks got a bounce as the Euro finally firmed for a day. The seasonal patterns for the stock market are still bullish this time of year. These include yearend window dressing, the Santa Claus rally, historic returns in December, the January effect and the six-month cycle... Read More
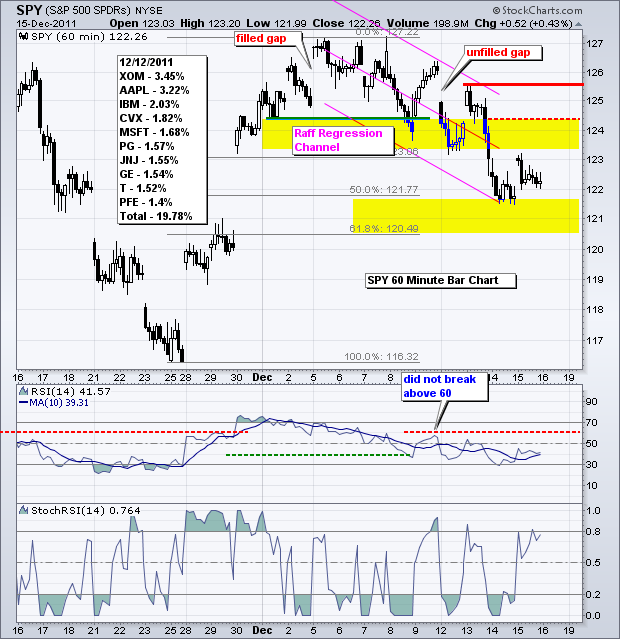
Art's Charts December 15, 2011 at 05:46 AM
The risk-off trade remained in force on Wednesday with oil joining the sell-off in stocks, the Euro and gold. US Treasuries and the Dollar benefitted from a flight to safety. Concerns over Europe continue to dominate the headlines as Italian 10-year yields moved to 6.69%... Read More
Art's Charts December 15, 2011 at 05:42 AM
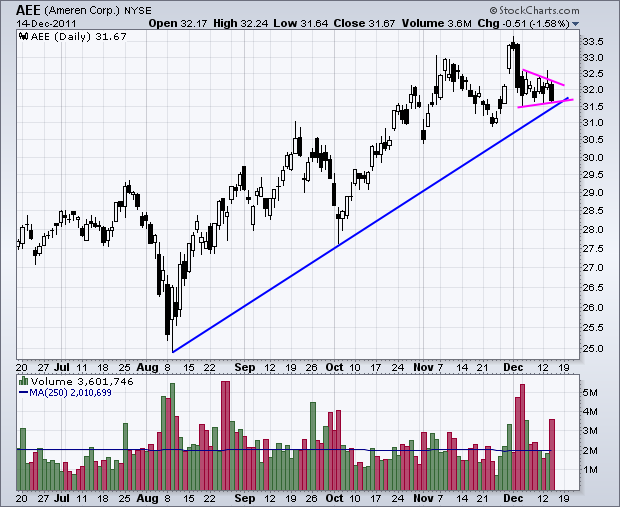
AEE Forms Pennant after Sharp Decline. CVX Breaks Support on High Volume. GGP Stalls with Bull Flag. Plus AMGN, CPN, GE This commentary and charts-of-interest are designed to stimulate thinking... Read More
Art's Charts December 15, 2011 at 05:31 AM
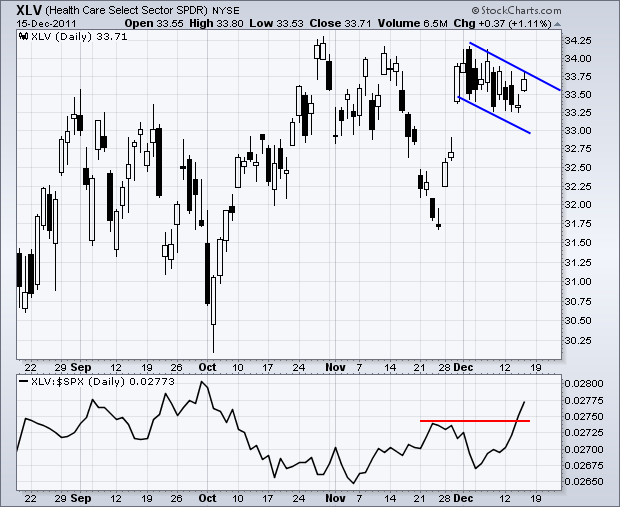
After a big surge in late November, the Healthcare SPDR (XLV) pulled back with the rest of the market and formed a falling flag the last few weeks. This is a bullish continuation pattern and a break above 34 would reverse the three week slide... Read More
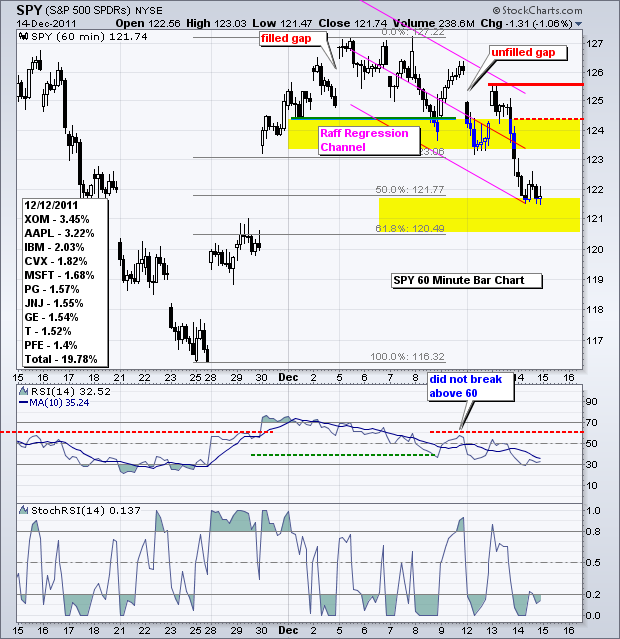
Art's Charts December 14, 2011 at 04:11 AM
The risk-off trade took hold in the markets with stocks and the Euro falling. Bonds and the Dollar surged, but oil bucked the trend with a big gain. I am not sure how long oil can hold up in the face of a strong Dollar and weak stock market... Read More
Art's Charts December 13, 2011 at 04:55 AM
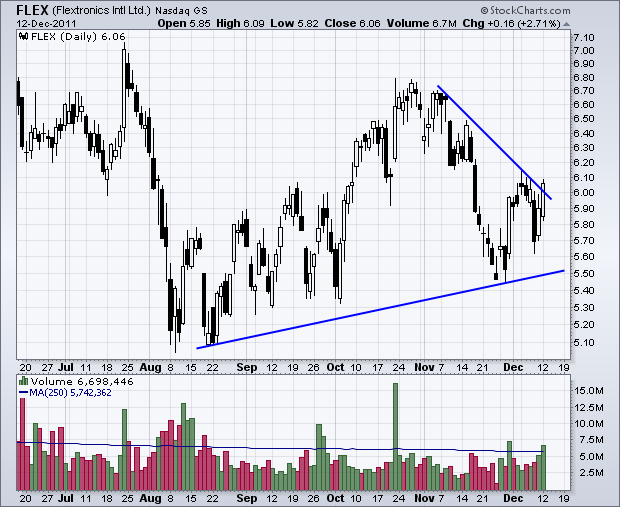
FLEX Flexes its Muscles. MMM Hits Big Resistance Zone. TEVA Forms Bullish Pennant. Plus THO, TTWO, URBN This commentary and charts-of-interest are designed to stimulate thinking... Read More
Art's Charts December 13, 2011 at 04:03 AM
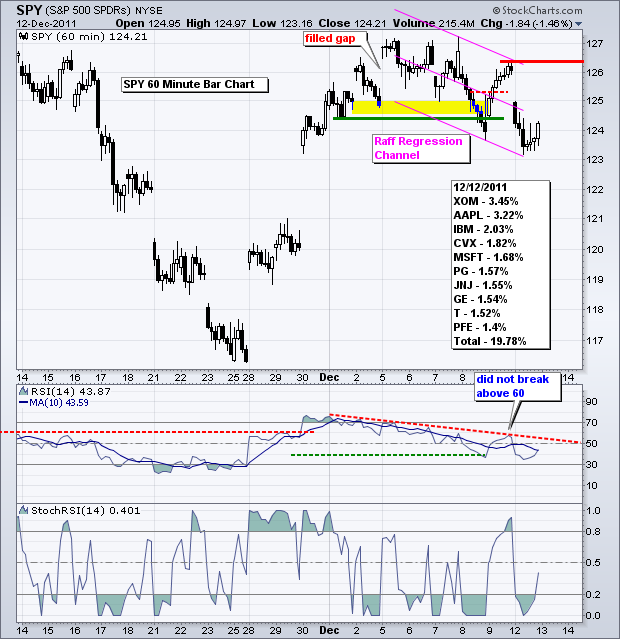
Even though the seasonal patterns are bullish, stocks remain under pressure and the stt trends are down... Read More
Art's Charts December 12, 2011 at 05:20 AM
It looks like we had some sell-the-rumor and buy-the-news. Rumors of an EU breakdown were swirling on Thursday and this caused a sell-off in stocks. However, these rumors were squashed with an agreement to agree on fiscal constraints... Read More
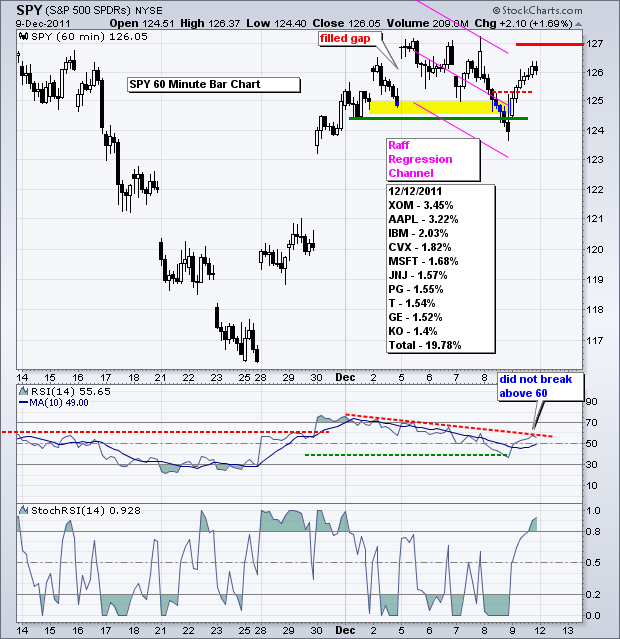
Art's Charts December 09, 2011 at 06:02 AM
There is not much change in the indicator summary. I upgraded the NYSE AD Line because this chart looks just like the charts for the Nasdaq and NYSE AD Volume Lines. The Nasdaq AD Line remains bearish so the AD Lines as a whole are neutral... Read More
Art's Charts December 09, 2011 at 04:26 AM
The negotiation marathon continues in Brussels. The 27-nation block fell apart as the UK and Hungary opted out of the current deal. Eurocrats are, however, making progress with the remaining 17 plus 6 or so... Read More
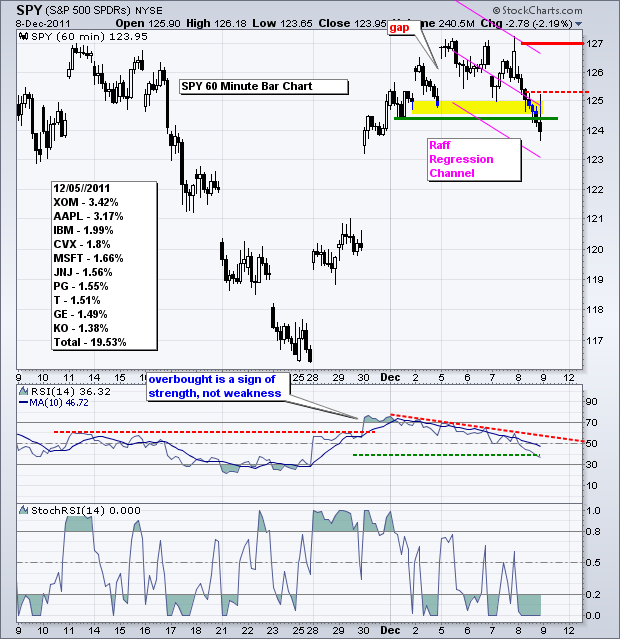
Art's Charts December 08, 2011 at 05:38 AM
Today is the day – or rather two days. The European Central Bank (ECB) will make its policy statement and the 2-day EU summit starts. There are plenty of good reads and opinions regarding the EU situation. At the end of the day it boils down to probabilities and realities... Read More
Art's Charts December 08, 2011 at 05:25 AM
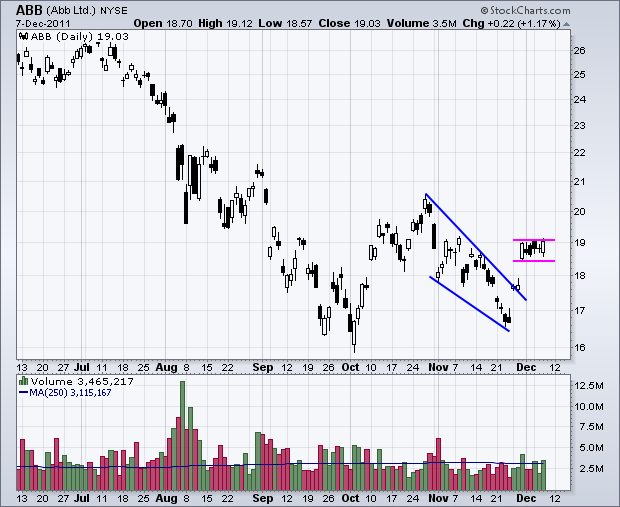
ABB Consolidates after Breakout Surge. ECA Bounces off Support for Potential Double Bottom. XRAY Forms Bullish Pennant. Plus ABT and HPQ. This commentary and charts-of-interest are designed to stimulate thinking... Read More
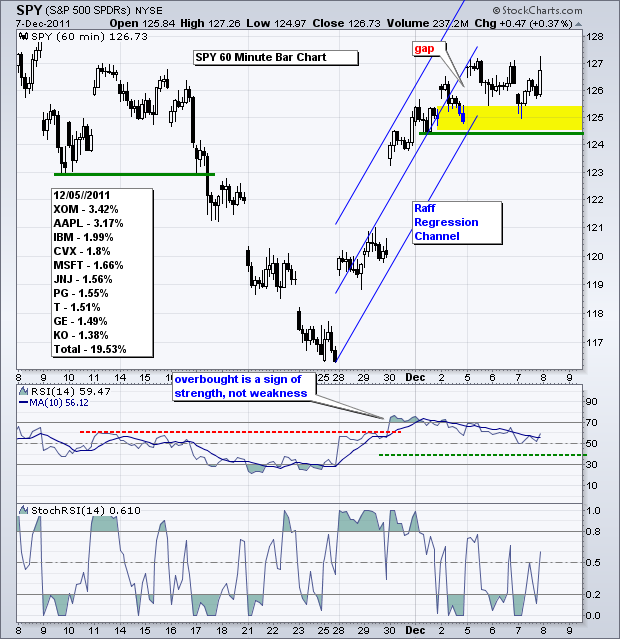
Art's Charts December 07, 2011 at 04:07 AM
The stock market held its breadth yesterday as the major index ETFs were barely changed the entire day. No change in the short-term uptrend means the short-term uptrend remains in play... Read More
Art's Charts December 06, 2011 at 07:17 AM
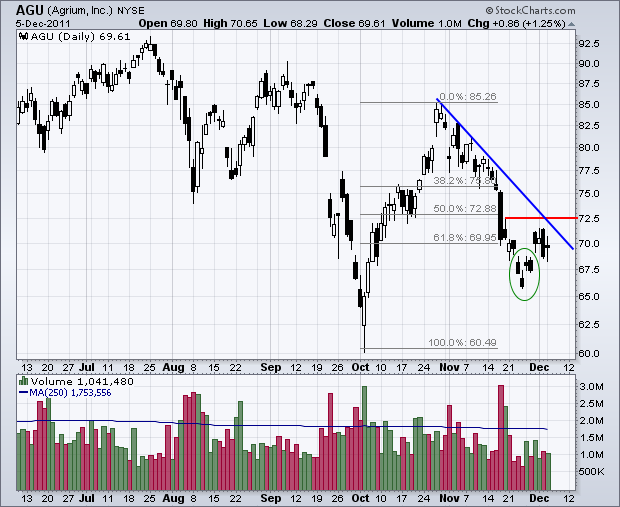
AGU Consolidates after Island Reversal. MAS Challenges Flag Resistance. SHAW Forms Small Flag after Breakout. Plus ALTR, AMCC, JCOM This commentary and charts-of-interest are designed to stimulate thinking... Read More
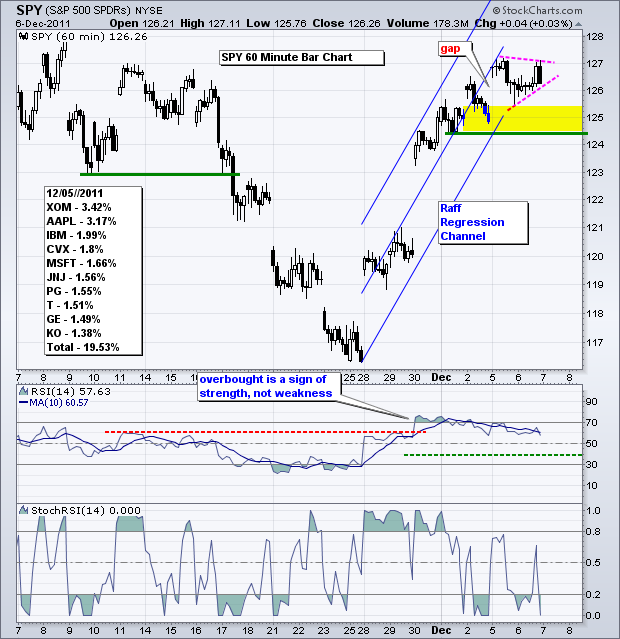
Art's Charts December 06, 2011 at 04:31 AM
This could be the week that breaks the bear's back or triggers a sharp reversal at resistance. While US ties to Europe are relatively small as a percentage of GDP, Europe's influence on the stock market and Dollar has been relatively large... Read More
Art's Charts December 05, 2011 at 04:24 AM
That was one heck of a rally last week. SPY and QQQ surged over 7% and IWM was up over 10%. Was last week's surge an August-September surge or an October surge? A 7% surge in SPY compares to the beginning of October, which preceded a huge advance... Read More
Art's Charts December 03, 2011 at 09:38 AM
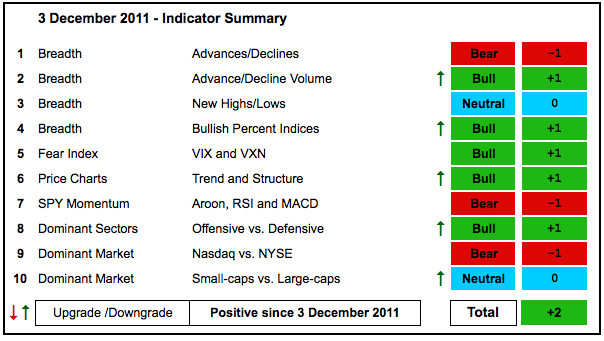
With this week's big move, the indicator summary flipped from negative to positive. There are clearly some judgment calls at work here. It really boils down to accepting this week's surge as the real deal. The alternative is that it was just one heck of a dead-cat bounce... Read More
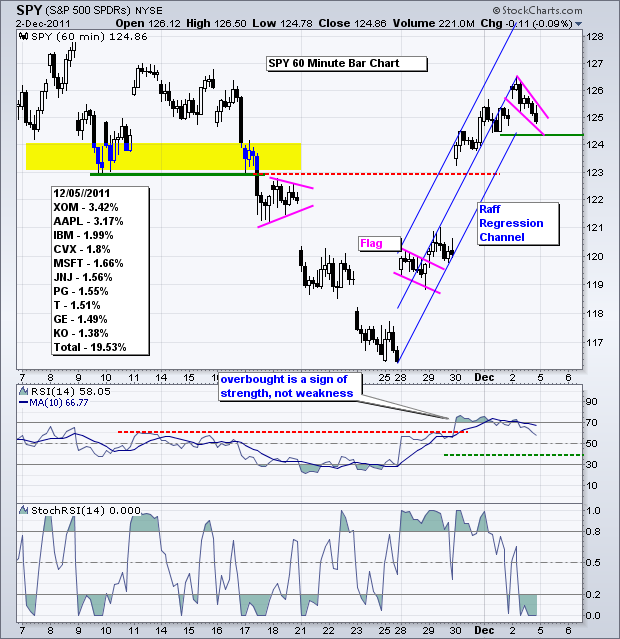
Art's Charts December 02, 2011 at 04:56 AM
This market is just itching to continue higher. As I write, the Dow futures are of over 100 points. Hints of a European deal are in the air, the US economic numbers have been pretty good and central banks are printing money... Read More
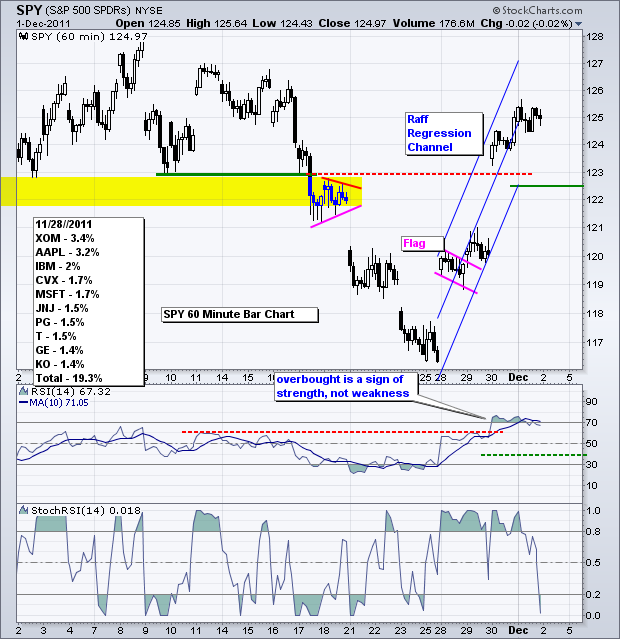
Art's Charts December 01, 2011 at 06:03 AM
Coordinated action from five central banks sparked a massive rally in the finance sector (+6.17%) that extended to the rest of the market. All sectors were up. Seven of nine were up more than 3%. Utilities and consumer staples were up less than 3%... Read More
Art's Charts December 01, 2011 at 05:53 AM
BBY Forms Dark Cloud at Key Retracement. FDX Breaks Flag Resistance. RL Traces out Bear Wedge. Plus AMZN, LOW, LUV, WY This commentary and charts-of-interest are designed to stimulate thinking... Read More