Art's Charts January 31, 2012 at 05:12 AM
Stocks corrected somewhat over the last three days, but managed to recover after a weak open on Monday. Risk-on is in the air this morning after the EU agreed to a "fiscal compact". Stocks futures, oil, gold and the Euro are higher in early trading (4AM ET)... Read More
Art's Charts January 31, 2012 at 05:08 AM
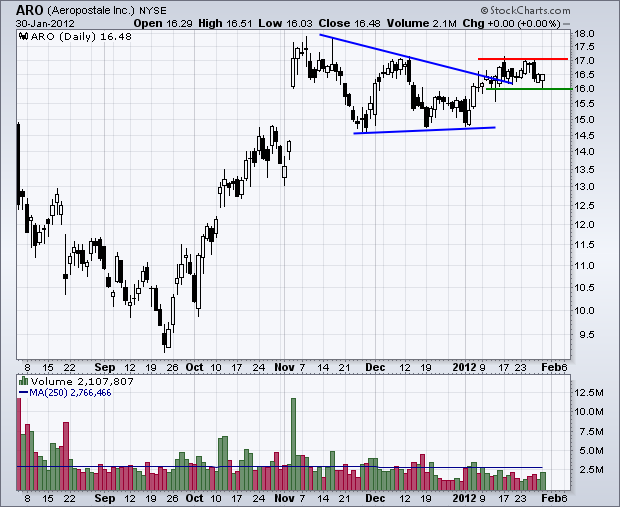
Care out there. It is still earnings season. ARO Consolidates after Triangle Breakout. CERN Firms at Key Retracement. NBR Bounces off Triangle Support. Plus ATVI, NTAP, PTEN and VIP. This commentary and charts-of-interest are designed to stimulate thinking... Read More
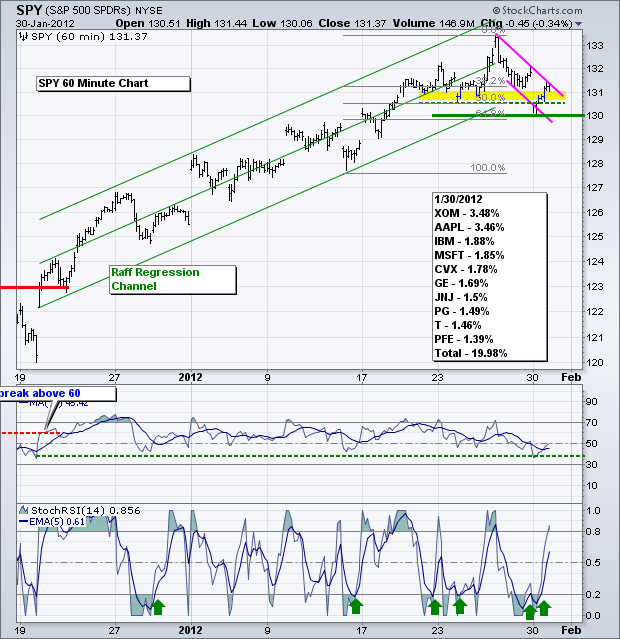
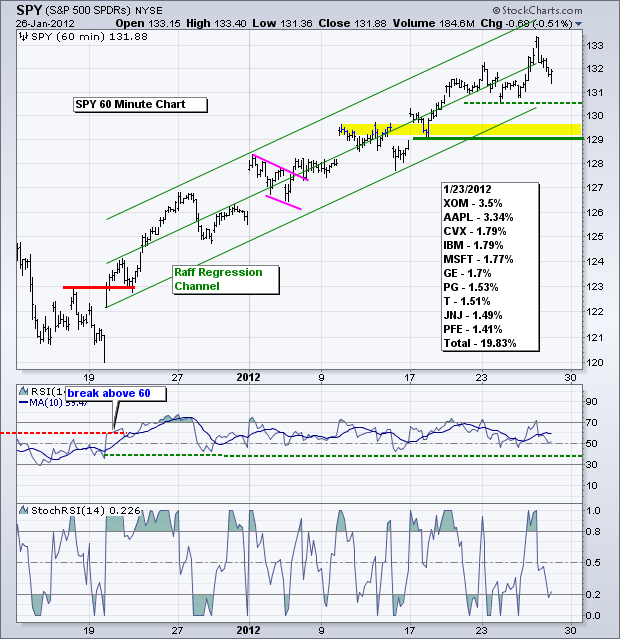
Art's Charts January 30, 2012 at 04:54 AM
Even though the short-term uptrends remain in place, the major index ETFs are overbought and ripe for a correction. Corrections can evolve as pullbacks or sideways trading ranges... Read More
Art's Charts January 27, 2012 at 06:27 AM
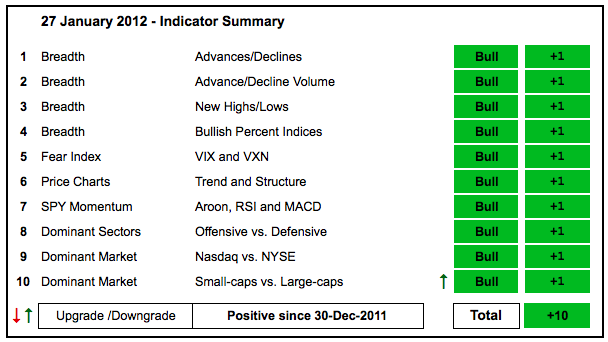
With one more upgrade, all ten indicator groups are in bull mode. Relative performance of small-caps was the lagging indicator, but small-cap performance perked up this month as the $RUT:$OEX ratio broke above its December highs... Read More
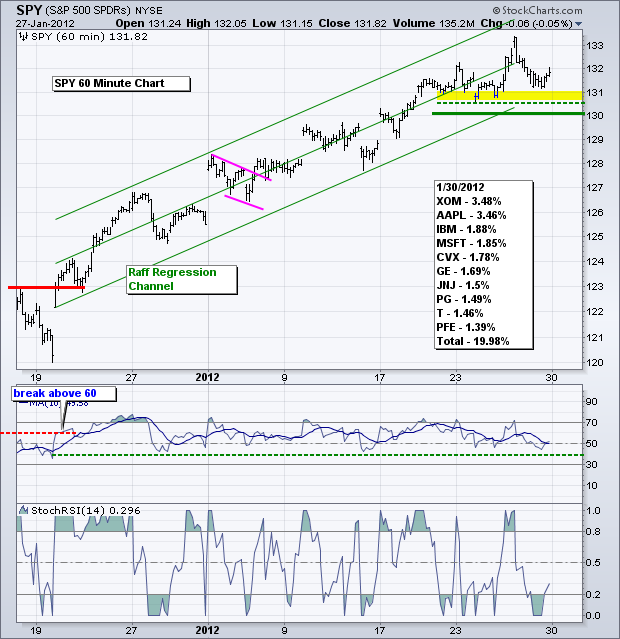
Art's Charts January 27, 2012 at 05:08 AM
Stocks opened strong and then sold off to close with small losses. A little pop and drop is normal with the stock market so overbought. Even so, selling pressure was not that strong and the short-term uptrends remain in place... Read More
Art's Charts January 26, 2012 at 07:25 AM
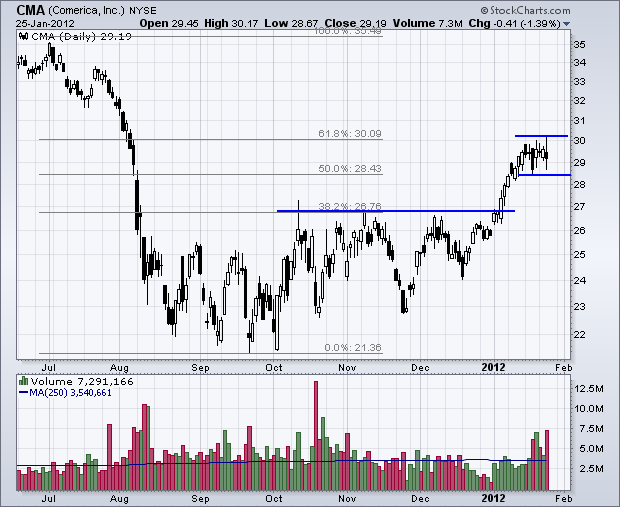
CMA Stalls at Key Retracement. SSP Consolidates with Triangle Formation. UIS Bounces off Key Retracement with High Volume. Plus JPC, JWN, WHR This commentary and charts-of-interest are designed to stimulate thinking... Read More
Art's Charts January 26, 2012 at 03:51 AM
There is nothing like a little Fed frenzy. Stocks surged after the Fed announced an extension of their zero interest rate policy. Treasuries surged ahead of the statement, but gave it all back afterwards. The Dollar fell sharply and commodities surged in the afternoon... Read More
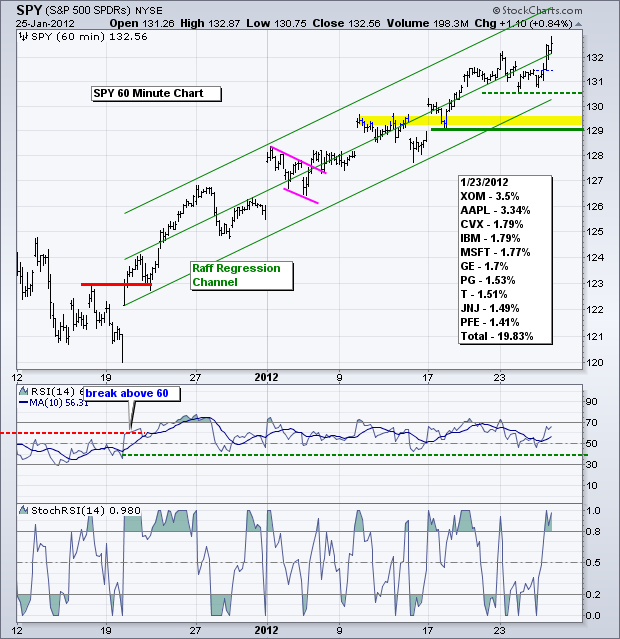
Art's Charts January 25, 2012 at 04:19 AM
Another blowout quarter from Apple is lifting the Nasdaq futures this morning, but the rest of the market is rather subdued as the Fed's policy statement looms this afternoon. Stocks ended mixed on Tuesday as indecision continued ahead of the Fed... Read More
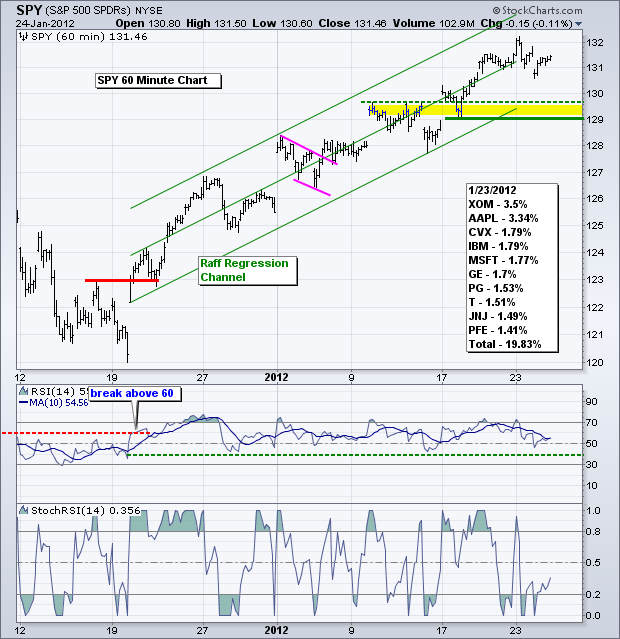
Art's Charts January 24, 2012 at 06:18 AM
It is another big day on the earnings front. McDonalds, Baker Hughes and Air Products report before the open. Apple, Altera, AMD and Yahoo report after the market close. In addition to a big earnings week, we have EU debt wrangling, rumors on Portugal and a FOMC meeting... Read More
Art's Charts January 24, 2012 at 05:32 AM
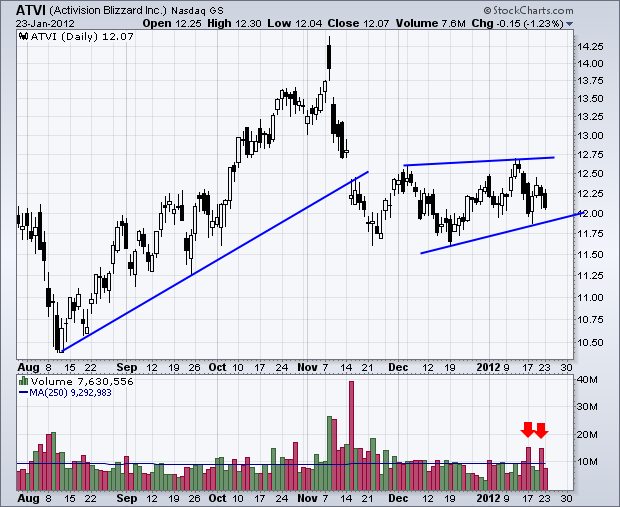
Careful out there during earnings season. ATVI Declines on High Volume GFI Consolidates Near Wedge Breakout. GT Forms Pennant after Sharp Decline... Read More
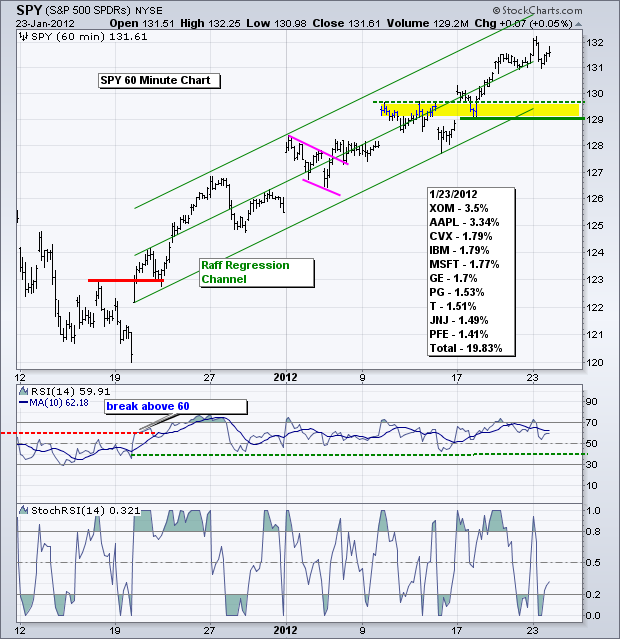
Art's Charts January 23, 2012 at 04:53 AM
It could be a volatile week, but what else is new. EU finance ministers are meeting to discuss the Greek debt situation because Greece is facing a large rollover in March. The Fed meets on Tuesday-Wednesday with a policy statement expected on Wednesday afternoon... Read More
Art's Charts January 20, 2012 at 06:23 AM
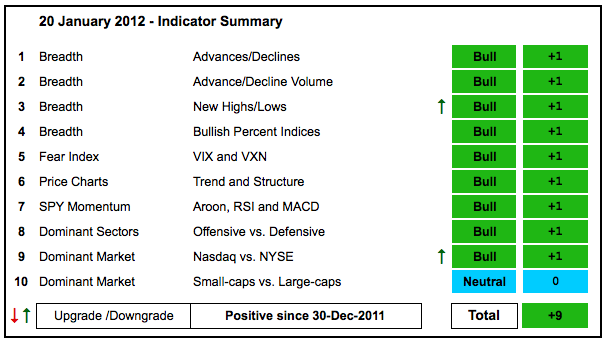
With two more upgrades, the indicator summary is now at plus nine. The only indicator not bullish is the $RUT:$OEX ratio because it has yet to convincingly break resistance... Read More
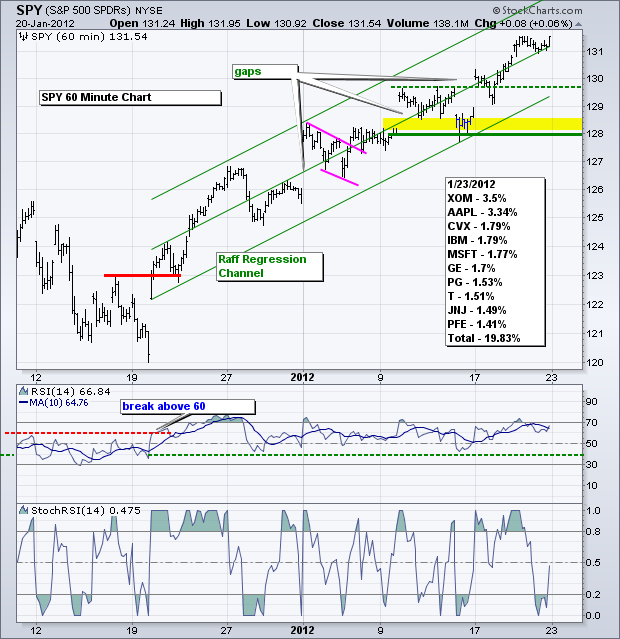
Art's Charts January 20, 2012 at 04:55 AM
Bank and tech earnings were largely positive on Thursday and stocks moved higher. Today we will hear from Schlumberger and General Electric, which will impact oil services and industrials... Read More
Art's Charts January 19, 2012 at 05:47 AM
It is a big day on the earnings front. Judging from the rally over the last 4-5 weeks, it looks like most reports will be better than expected. Financials dominate the premarket reports with Bank of America, BB&T and Morgan Stanley reporting earnings before the open on Thursday... Read More
Art's Charts January 19, 2012 at 05:38 AM
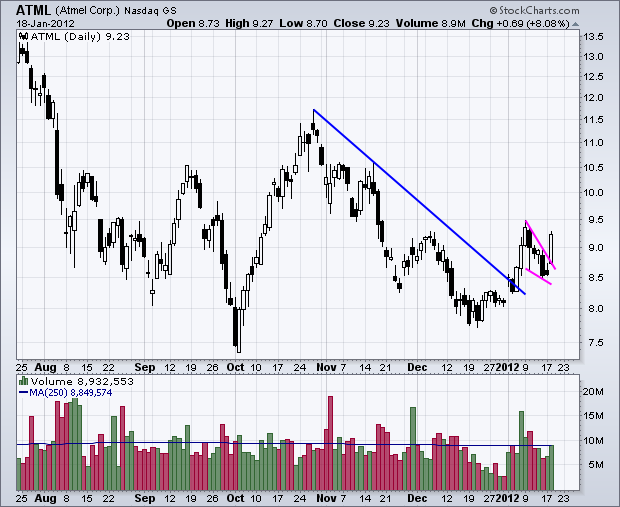
Careful out there. It is earnigns season. ATML Surges above Wedge Resistance. GFI Gaps above late December High. SLB Forges Outside Reversal Day on Big Volume. This commentary and charts-of-interest are designed to stimulate thinking... Read More
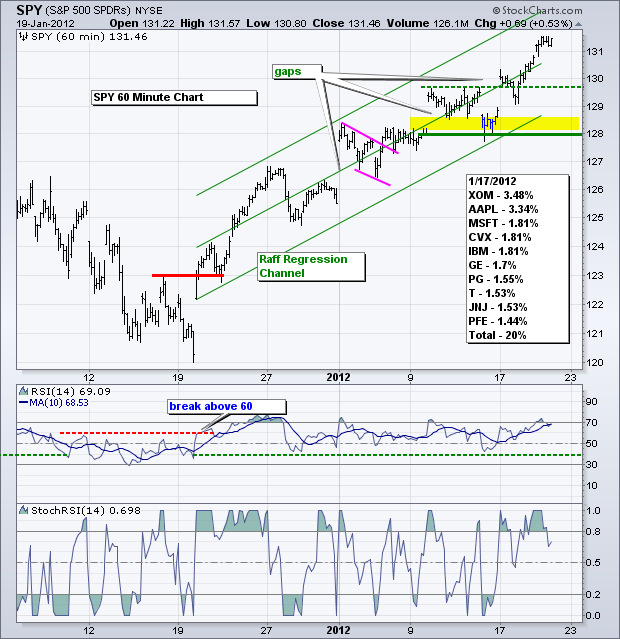
Art's Charts January 18, 2012 at 04:55 AM
The short-term uptrend for the S&P 500 ETF (SPY) began with the breakout on December 20th and is now entering its 19th day, which is pretty long for a short-term uptrend. Also note that the ETF is up around 8% from its December 19th low... Read More
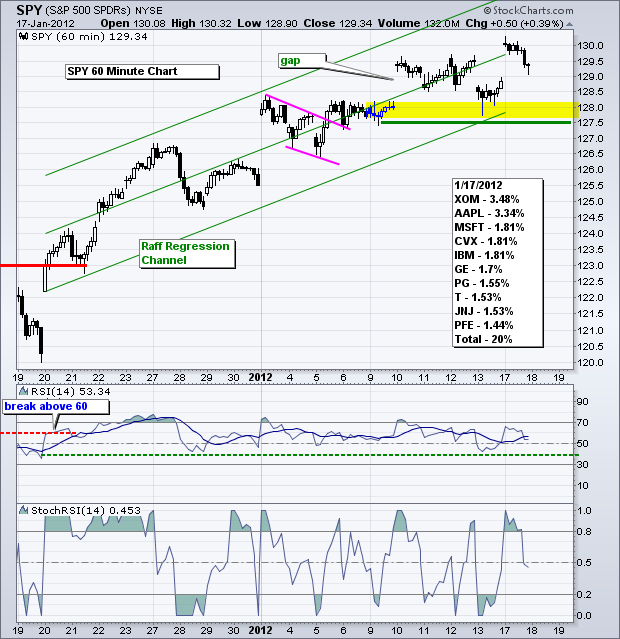
Art's Charts January 17, 2012 at 05:46 AM
Rumors that Standard & Poor's was going to downgrade the debt rating for several EU countries sent stocks sharply lower on the open Friday morning. Stocks remained down as rumors swirled, but did not add to their losses... Read More
Art's Charts January 17, 2012 at 05:10 AM
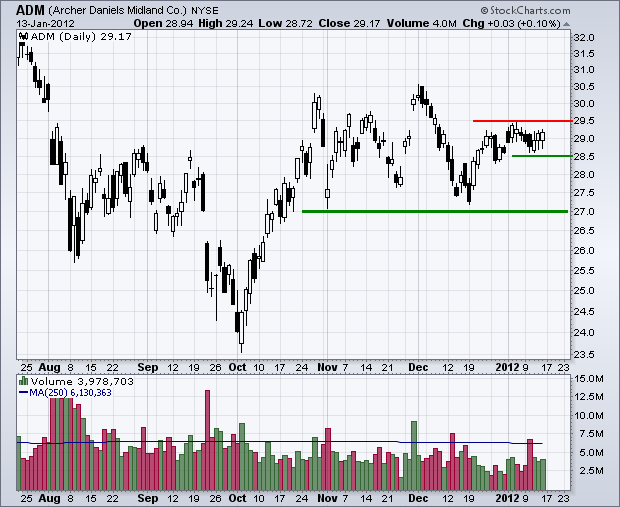
ASEI Recovers on Strong Volume. EQR Forms Bullish Engulfing on High Volume. NE Surges off Consolidation Support. | Plus ADM, ADSK, AMZN, EQR, PCLN, TKC, VLO This commentary and charts-of-interest are designed to stimulate thinking... Read More
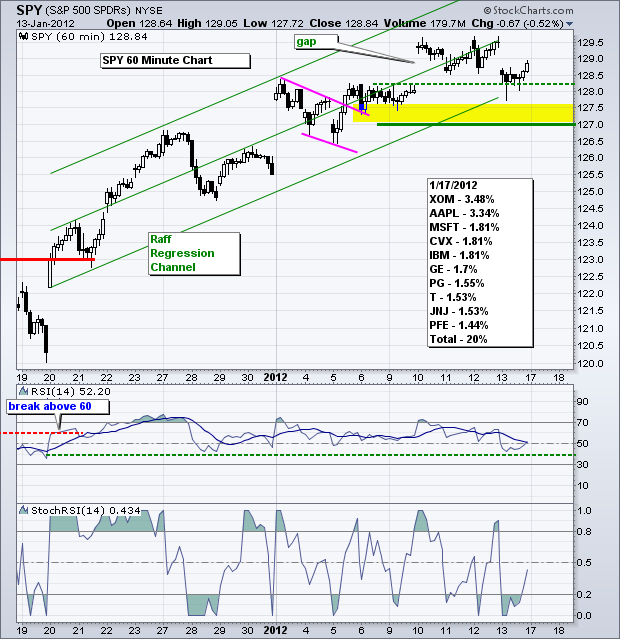
Art's Charts January 13, 2012 at 06:00 AM
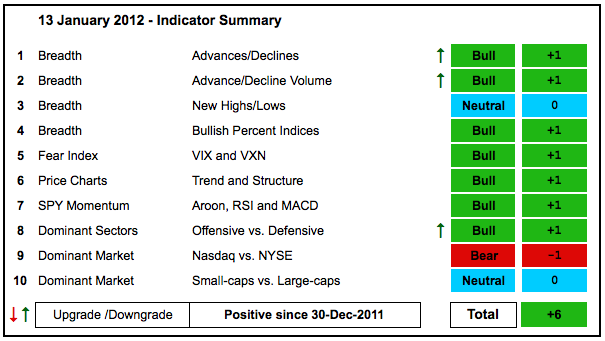
With another strong week in the stock market, the indicator summary improved with three indicator upgrades. The AD Lines are considered bullish because the NYSE AD Line broke its summer highs and the Nasdaq AD Line broke its early December high... Read More
Art's Charts January 13, 2012 at 03:46 AM
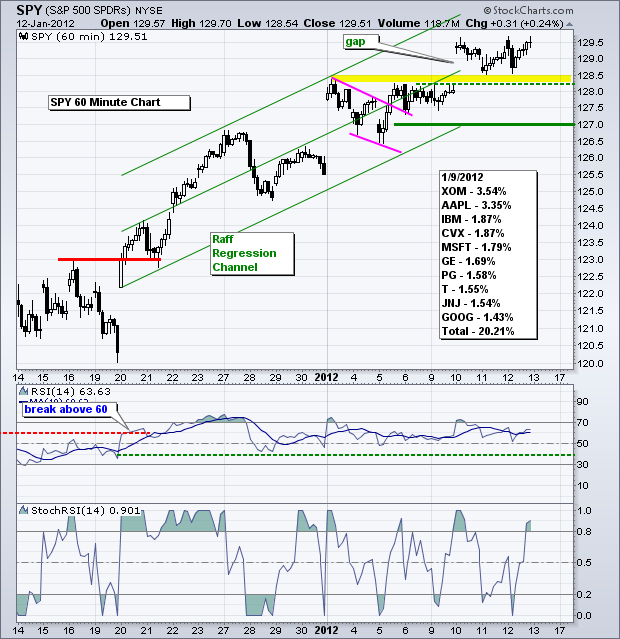
Despite lackluster retail sales, stocks recovered from early losses on Thursday and closed near their highs for the session. The sectors were mixed with materials and industrials posting the biggest gains. Utilities and energy were down... Read More
Art's Charts January 12, 2012 at 05:46 AM
The intermarket picture is getting a bit strange. We have already seen the Euro and the stock market decouple in 2012. Over the last three days, we are also seeing a positive correlation between treasuries and stocks... Read More
Art's Charts January 12, 2012 at 05:33 AM
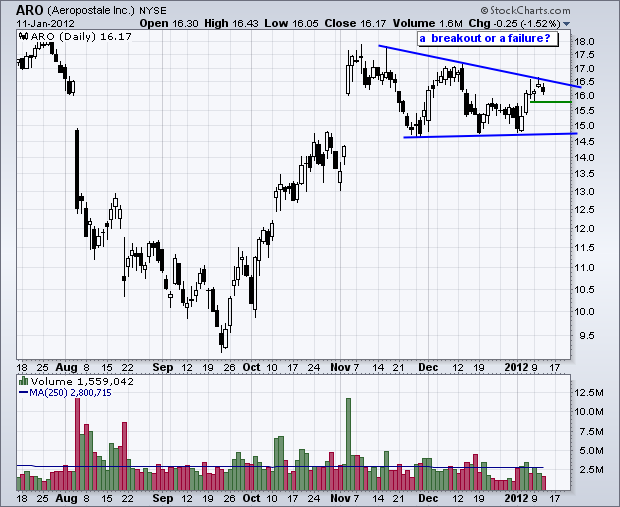
FLEX Breaks Resistance with Big Volume. LTD Tests Triangle Support. Bollinger Bands Narrow for XRAY. Plus ARO, EMC, GPS, X This commentary and charts-of-interest are designed to stimulate thinking... Read More
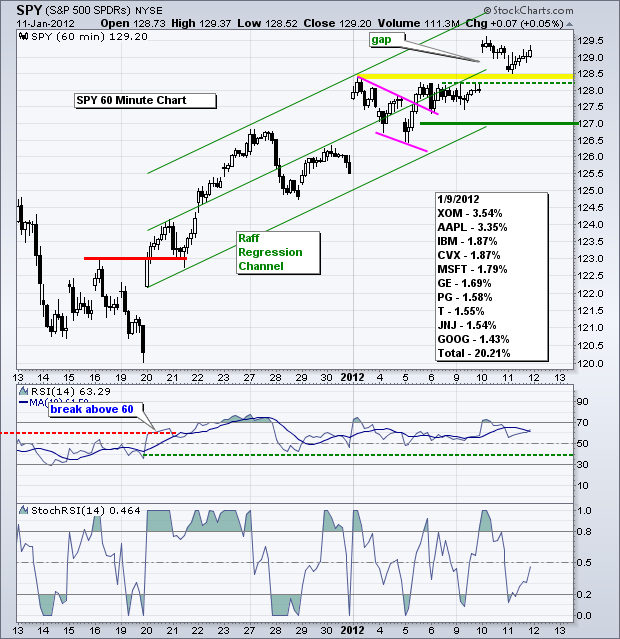
Art's Charts January 11, 2012 at 04:46 AM
Stocks surged on the open and then moved into a holding pattern the rest of the day. There was no upside follow through after the opening surge, but stocks held their gains and selling pressure was relatively muted... Read More
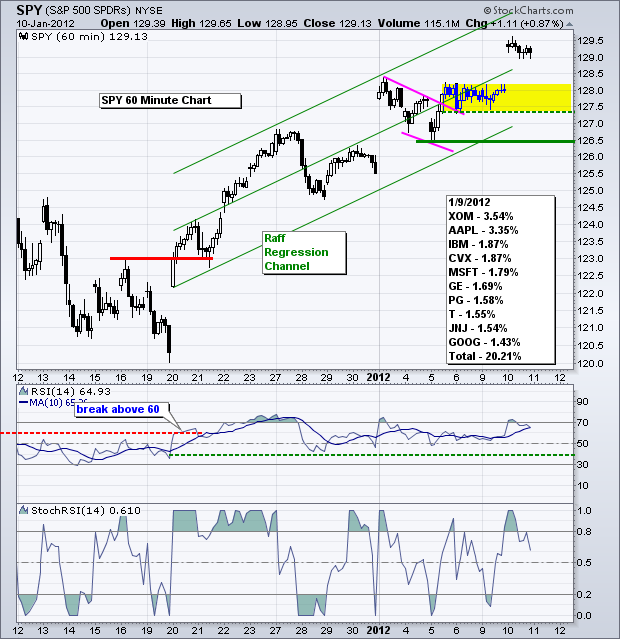
Art's Charts January 10, 2012 at 04:48 AM
There is not much change on the 60-minute chart for SPY. The ETF broke flag resistance with a surge late last week and then consolidated the last two days. The breakout is holding with first support marked at 127.20... Read More
Art's Charts January 10, 2012 at 04:36 AM
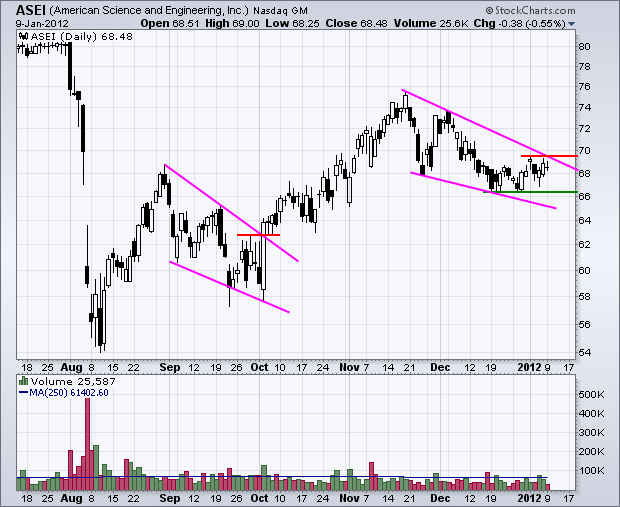
CRR Bounces of 61.80% Retracement. MCK Breaks Triangle Trendline. VRTX Breaks Resistance on High Volume. Plus ASEI, CI, SUSS, TIF This commentary and charts-of-interest are designed to stimulate thinking... Read More
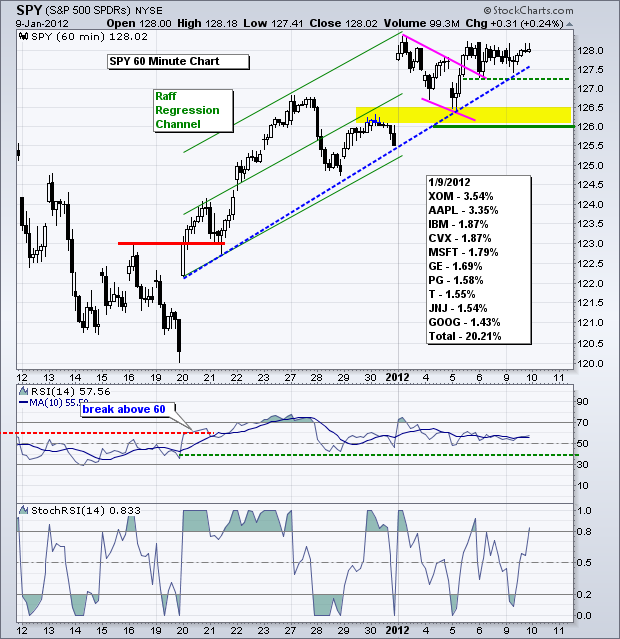
Art's Charts January 09, 2012 at 06:18 AM
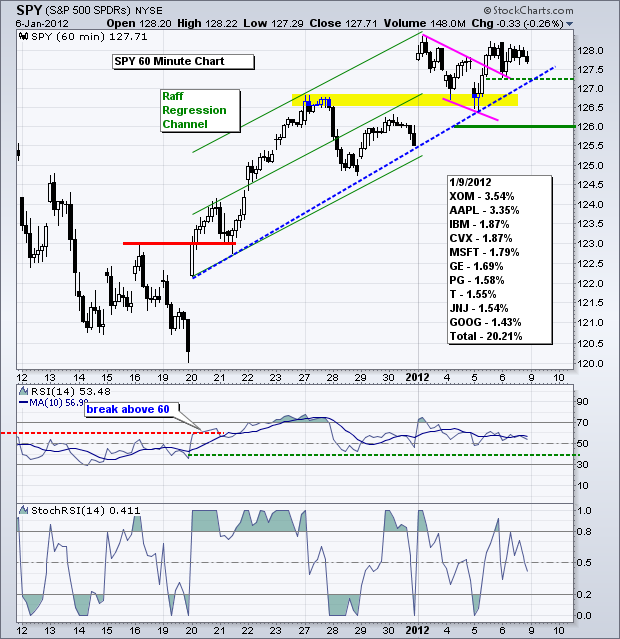
The S&P 500 ETF (SPY) did not move much after Tuesday's opening gap, but did manage to hold its gains and close near the high for the week. Even though the ETF did not follow through on this gap, the gains are still holding and the cup remains half full (bullish)... Read More
Art's Charts January 06, 2012 at 06:35 AM
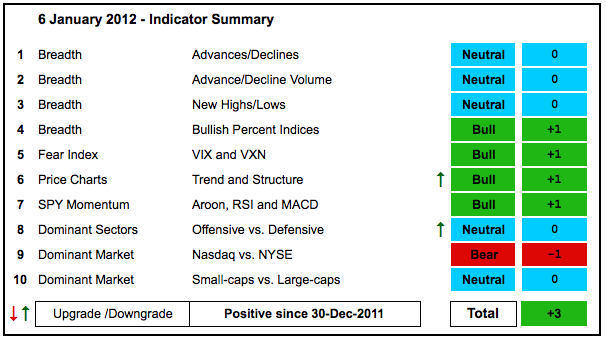
The indicator summary got a couple more upgrades this week and remains in positive territory. In particular, the Trend-Structure indicator was upgraded to bullish because the Dow Industrials SPDR, S&P 500 ETF and Nasdaq 100 ETF broke above their early December highs... Read More
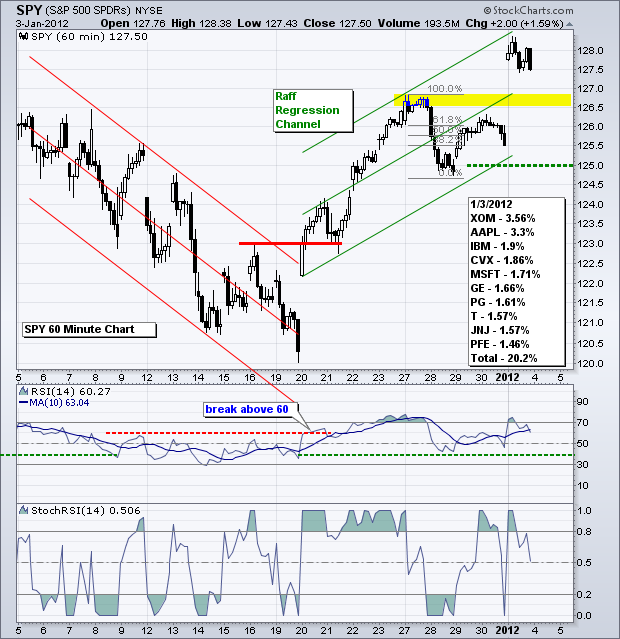
Art's Charts January 06, 2012 at 05:10 AM
The S&P 500 ETF (SPY) gapped up on Tuesday morning, formed a falling flag the next 2-3 days and then broke flag resistance with yesterday's surge. The short-term trend has been up since the breakout on December 20th and the bulls remain in charge... Read More
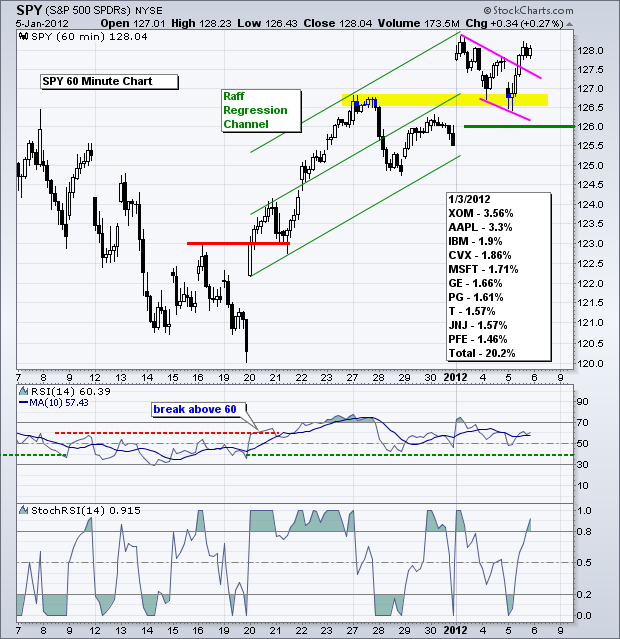
Art's Charts January 05, 2012 at 06:29 AM
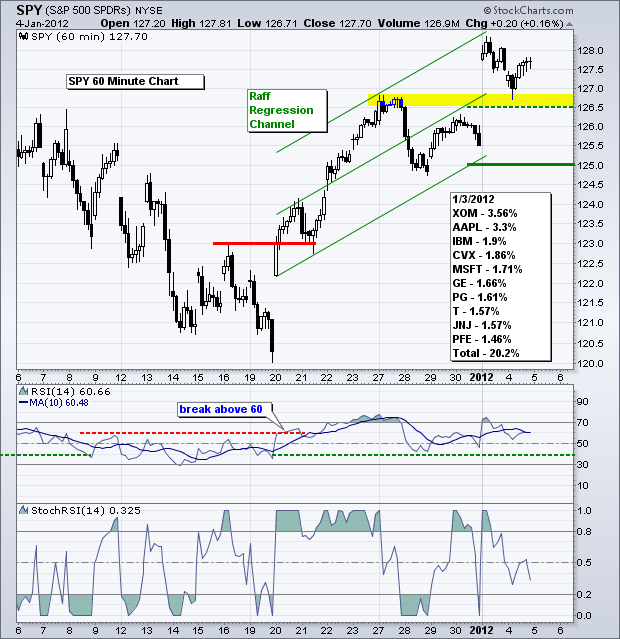
The S&P 500 ETF (SPY) remains in a short-term uptrend on the 60-minute chart. After a big gap on Tuesday morning, the ETF pulled back to broken resistance, which turned into the first support zone in the 126.50 area. SPY bounced back above 127... Read More
Art's Charts January 05, 2012 at 06:25 AM
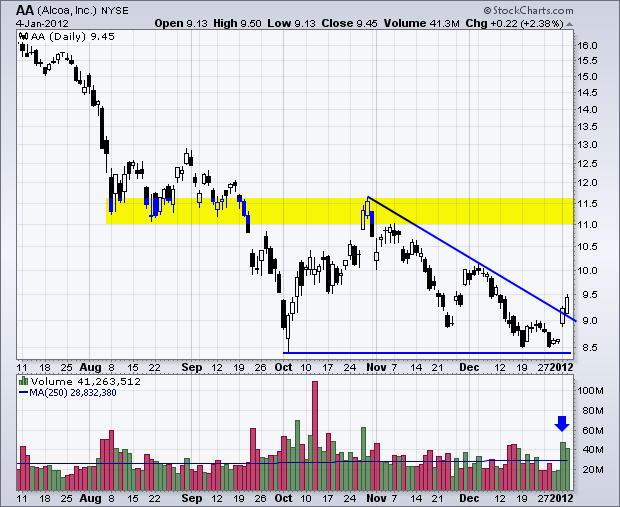
AA Surges off Support with Big Volume. LUV Consolidates after Strong Surge. WDC Forms Bullish Pennant after Breakout. Plus ANF, ATVI, WIN This commentary and charts-of-interest are designed to stimulate thinking... Read More
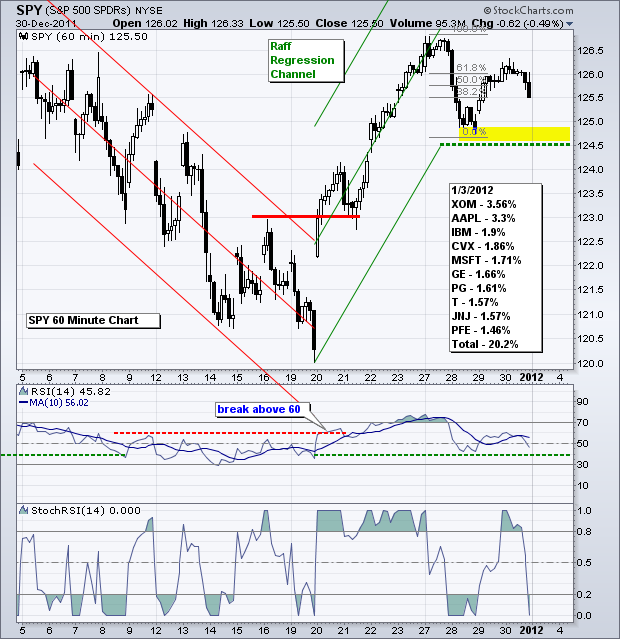
Art's Charts January 04, 2012 at 05:34 AM
Stocks surged on the open, but did not follow through on these opening gains... Read More
Art's Charts January 03, 2012 at 06:36 AM
It is a short, but packed week for the market with several key economic reports on deck. We have ISM Manufacturing and FOMC minutes on Tuesday, Factory Orders and Auto/Truck Sales on Wednesday, ISM Services and Jobless Claims on Thursday, and the big Employment Report on Friday... Read More
Art's Charts January 03, 2012 at 06:23 AM
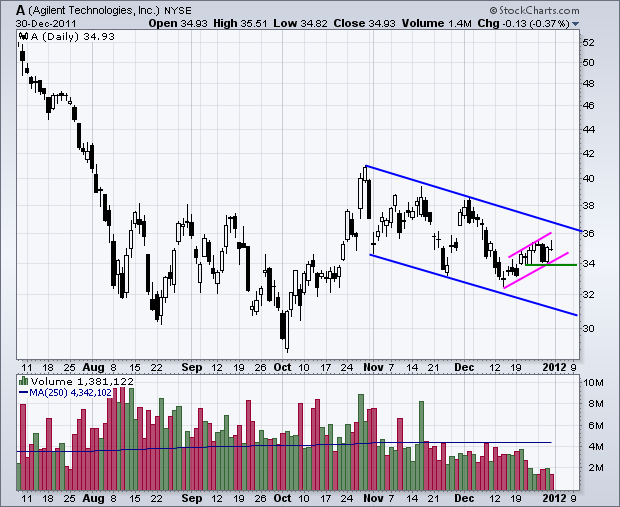
ARO Forms Pennant after Sharp Decline. SLB Firms at Support Zone. STX Challenges Wedge Trendline. Plus A, ALTR, CAT, ESRX, MGM This commentary and charts-of-interest are designed to stimulate thinking... Read More