Art's Charts June 29, 2012 at 07:17 AM
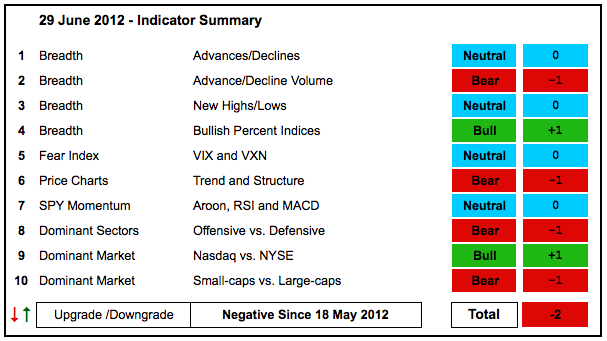
The June run is set to continue with stock futures up sharply on Friday. Continued strength means the indicator summary is improving. Note that the NYSE AD Line and NYSE Net New Highs are bullish... Read More
Art's Charts June 29, 2012 at 06:23 AM
Stocks ended mixed on Thursday as sharp rallies in the final hour paired losses significantly. The Nasdaq 100 ETF (QQQ) still lost over 1%, but the S&P Midcap SPDR (MDY) closed up .30% on the day. The nine sector SPDRs were mixed with four up and five down... Read More
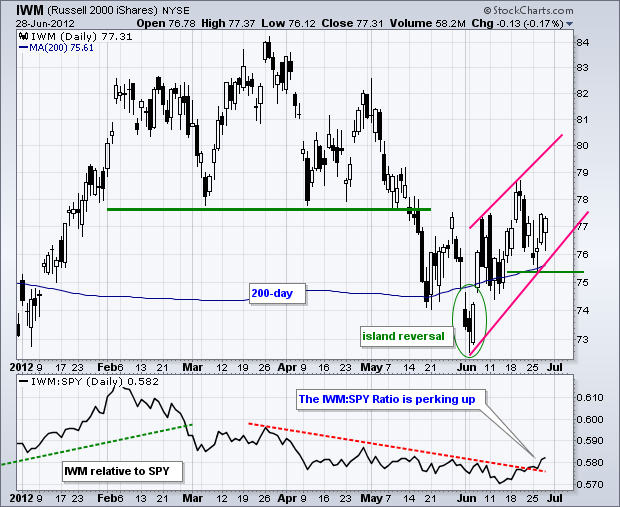
Art's Charts June 28, 2012 at 07:14 AM
Stocks extended their oversold bounce with modest gains on Wednesday. All major index ETFs were up with the Russell 2000 ETF leading the way (+1.63%). The Dow Industrials SPDR, S&P 500 ETF and Nasdaq 100 ETF were up less than 1%... Read More
Art's Charts June 28, 2012 at 07:06 AM
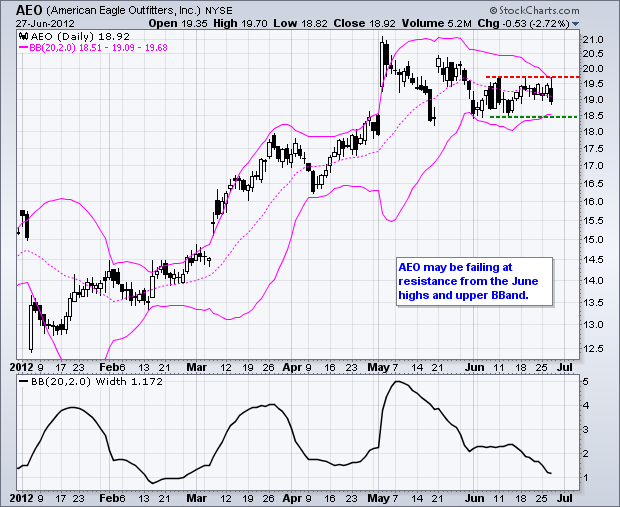
AEO Fails at Resistance. AAPL Stalls with Tablet War. HOTT Does not Look so Hot. Plus AMZN, DRI, SBUX, URBN This commentary and charts-of-interest are designed to stimulate thinking... Read More
Art's Charts June 27, 2012 at 04:20 AM
Stocks got an oversold bounce on Tuesday with the S&P MidCap 400 SPDR (MDY) leading the way. The gains, however, were quite modest with MDY up just .67% and the S&P 500 ETF (SPY) edging higher by .50%. Nothing to write home about for sure... Read More
Art's Charts June 26, 2012 at 07:03 AM
Stocks moved sharply lower on Monday with an extremely weak opening. The major index ETFs gapped down on the open, drifted lower throughout the morning and then edged off their lows in the afternoon... Read More
Art's Charts June 26, 2012 at 06:59 AM
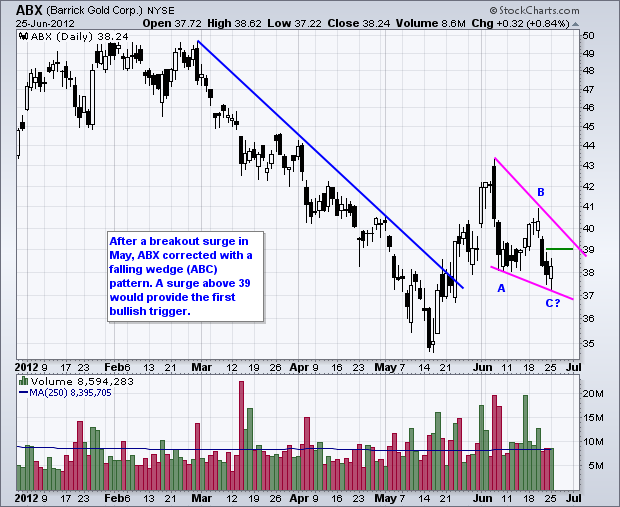
ABX Forms ABC Falling Wedge. HD Struggles at Resistance. NVDA Tests Gap Zone with Small Wedge. Plus AFFX, CX, MS, UTHR This commentary and charts-of-interest are designed to stimulate thinking... Read More
Art's Charts June 25, 2012 at 05:09 AM
It is shaping up to be another big week on Wall Street and in Europe. On the news front, we have some key economic reports, another critical EU Summit and a potential ruling on healthcare reform... Read More
Art's Charts June 22, 2012 at 05:55 AM
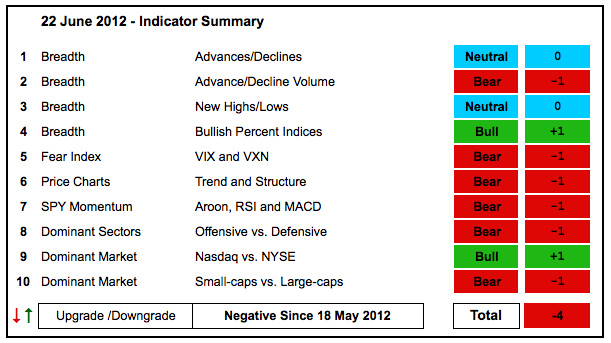
Stocks made a valiant run in June, but it was cut short with Thursday's sharp decline. Even though a few indicator groups were upgraded, the bulk of the evidence remains bearish... Read More
Art's Charts June 22, 2012 at 04:29 AM
The market started the week in risk-on mode, but made a sharp u-turn on Thursday with a move to risk-off. The major index ETFs were down sharply with small-caps (IMW) and mid-caps (MDY) leading the way. Both lost over 2.5% on the day... Read More
Art's Charts June 21, 2012 at 04:53 AM
Stocks edged lower on Wednesday as the Fed failed to inspire a continuation of the current rally. Except for the Nasdaq 100 ETF (QQQ), which gained .08%, the major index ETFs closed fractionally lower... Read More
Art's Charts June 21, 2012 at 04:48 AM
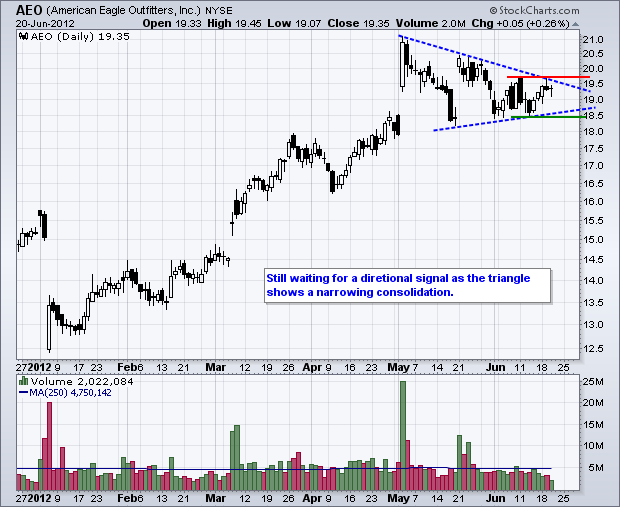
AEO Extends Consolidation with Tight Triangle. BIDU Shows Relative Weakness. JBLU Consolidates after High Volume Surge. Plus FFIV, FLEX, IDTI, LEN, OXY, RIMM, STT, TOL This commentary and charts-of-interest are designed to stimulate thinking... Read More
Art's Charts June 20, 2012 at 04:57 AM
Stocks moved higher again on Tuesday, but performance was lopsided again. The Russell 2000 ETF (IWM) led the market with a 1.73% gain, but the S&P 100 ETF (OEF) lagged with a .37% gain. Seven of the nine sectors were up... Read More
Art's Charts June 19, 2012 at 05:49 AM
It was a mixed day for stocks with the Dow Industrials SPDR (DIA) moving lower and the Nasdaq 100 ETF (QQQ) moving higher... Read More
Art's Charts June 19, 2012 at 05:44 AM
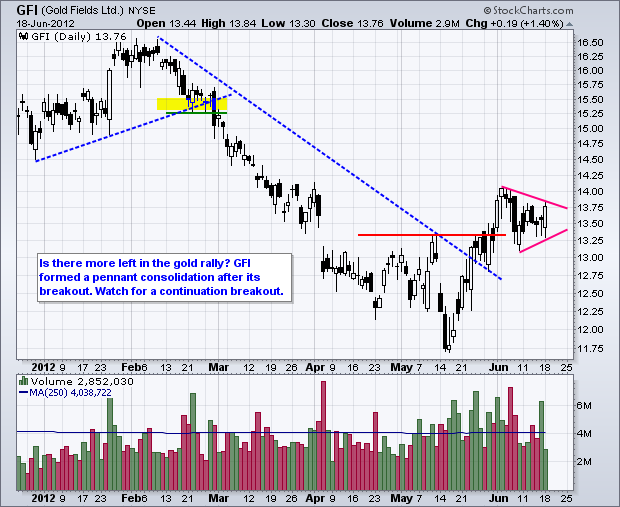
GFI Forms Pennant. ISIL Surges on Big Volume. MOS Breaks Inverse HS. Plus FICO, ISRG, NYT, THC, TSN This commentary and charts-of-interest are designed to stimulate thinking... Read More
Art's Charts June 18, 2012 at 05:36 AM
And the results are in! Pro-bailout party New Democracy won the Greek election with around 30% of the vote. They will now have three days to form a coalition with a parliamentary majority. Now comes the tough stuff... Read More
Art's Charts June 15, 2012 at 06:08 AM
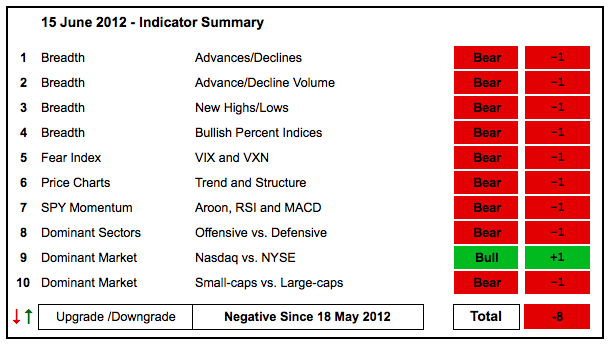
After a rebound last week, stocks turned flat this week and treaded water ahead of the Greek elections. The AD Volume Lines established minor resistance levels with the late May highs and breakouts would be short-term bullish... Read More
Art's Charts June 15, 2012 at 04:53 AM
Stocks caught a bid on Thursday with the major index ETFs closing modestly higher. The Dow Industrials SPDR (DIA) led the way with a 1.19% advance. The Nasdaq 100 ETF (QQQ) lagged with a .37% advance... Read More
Art's Charts June 14, 2012 at 05:23 AM
Stocks moved higher in the first half of the day and then lower in the second half. With the afternoon decline outpacing the morning advance, the major index ETFs closed modestly lower. Mid-caps led the decline with the S&P MidCap 400 SPDR (MDY) losing 1.34%... Read More
Art's Charts June 14, 2012 at 05:18 AM
LTD Forms Flat Flag after Sharp Decline. MMM Forms Harami at Key Retracement. SBUX Breaks Descending Triangle Support. Plus AES, APC, COV This commentary and charts-of-interest are designed to stimulate thinking... Read More
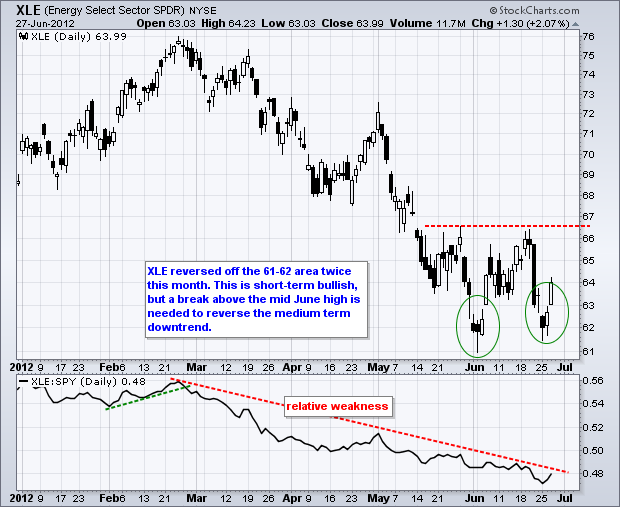
Art's Charts June 13, 2012 at 11:28 AM
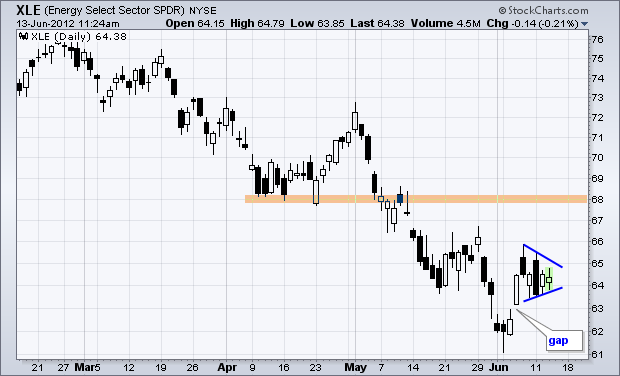
The Energy SPDR (XLE) remains in a downtrend overall, but signs of life are appearing as the ETF gapped higher last week and formed a pennant over the last five days... Read More
Art's Charts June 13, 2012 at 04:30 AM
Stocks rebounded after Monday's bearish reversal day with the major index ETFs gaining over 1%. The Dow Industrials SPDR (DIA) led the way with a 1.61% gain, while the S&P MidCap 400 SPDR (MDY) lagged with a 1.01% gain... Read More
Art's Charts June 12, 2012 at 04:54 AM
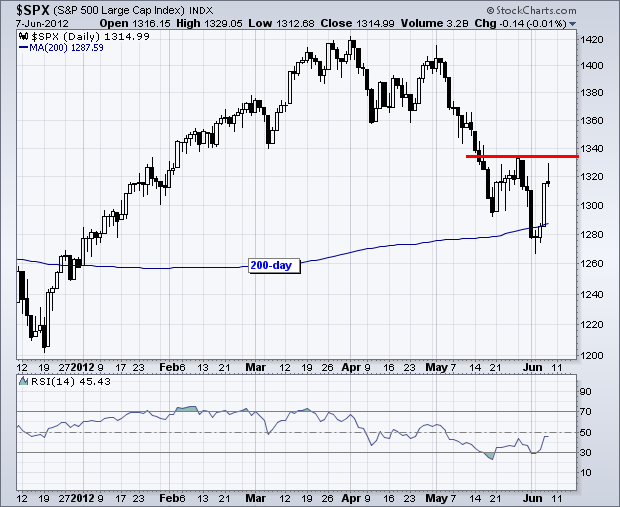
Stocks surged on the open with the S&P 500 exceeding 1335 in the first 5 minutes of trading. Selling pressure hit after five minutes of euphoria and the index closed below 1308. $SPX swung 2% from high to low and closed down over 1% on the day... Read More
Art's Charts June 12, 2012 at 04:48 AM
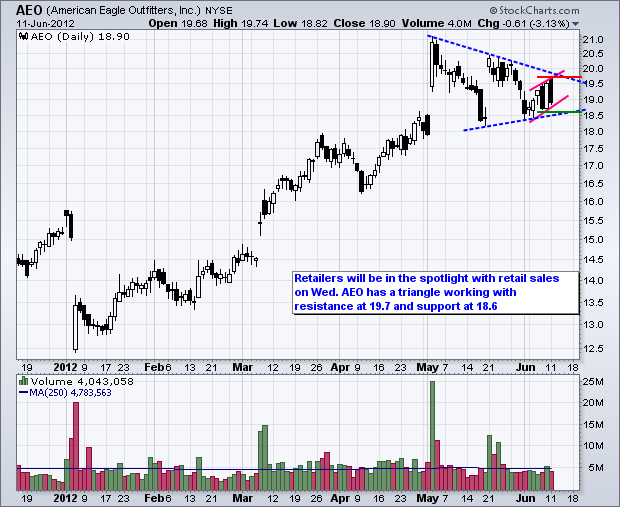
AEO Forms Triangle as Retail Sales Report Looms. HAS Shows Weakness with Pennant Break. TE Breaks Falling Wedge Resistance with Good Volume. Plus BXP, DRI, F, HES, TOL, VLO This commentary and charts-of-interest are designed to stimulate thinking... Read More
Art's Charts June 11, 2012 at 05:08 AM
Stocks opened weak on Friday, but rallied throughout the day and closed strong. Rumors of a Spanish bailout fueled los toros (the bulls). Small-caps led the way higher with the Russell 2000 ($RUT) gaining over 1% on the day... Read More
Art's Charts June 08, 2012 at 04:18 AM
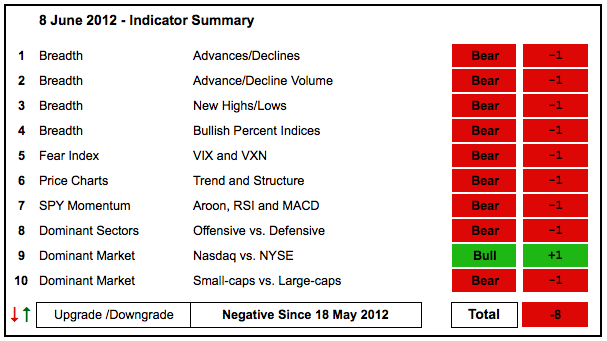
Stocks bounced this week, but the bounce was clearly not enough to rattle the indicator summary, which remains firmly negative. The AD Volume Lines surged, but remain well below their May support breaks and in downtrend... Read More
Art's Charts June 08, 2012 at 03:38 AM
Stocks asked for stimulus and failed to get what they wanted. The EU has yet to come forth with a concrete plan for EU banks, Bernanke did not offer hints of quantitative easing and the ECB stands ready to act... Read More
Art's Charts June 07, 2012 at 06:21 AM
It was a classic stimulus-response rally on Wednesday. Wait, I did not see any actual stimulus. In reality, the market was anticipating stimulus in Europe, the US and elsewhere around the world... Read More
Art's Charts June 07, 2012 at 04:26 AM
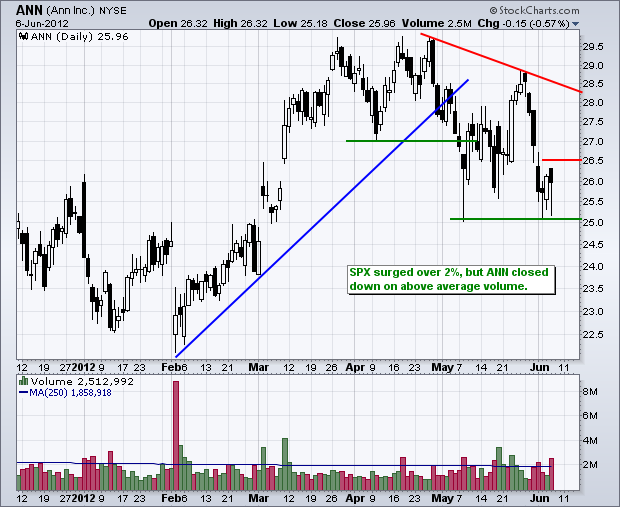
ANN Closes Lower and Shows Relative Weakness. BAC Holds above Late May Low and Breaks Resistance. ROL Shows Relative Strength with a Bull Flag. Plus CCL, DDS, LH This commentary and charts-of-interest are designed to stimulate thinking... Read More
Art's Charts June 06, 2012 at 04:45 AM
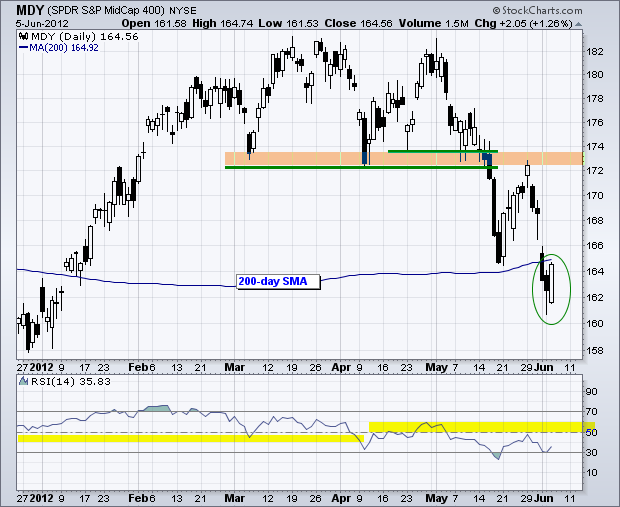
Stocks bounced on Monday with small-caps and mid-caps leading the way. The Russell 2000 ETF (IWM) gained around 1% and the S&P MidCap 400 SPDR (MDY) surged 2.05%. The chart below shows MDY forming a bullish engulfing as it surged back towards its 200-day moving average... Read More
Art's Charts June 05, 2012 at 05:03 AM
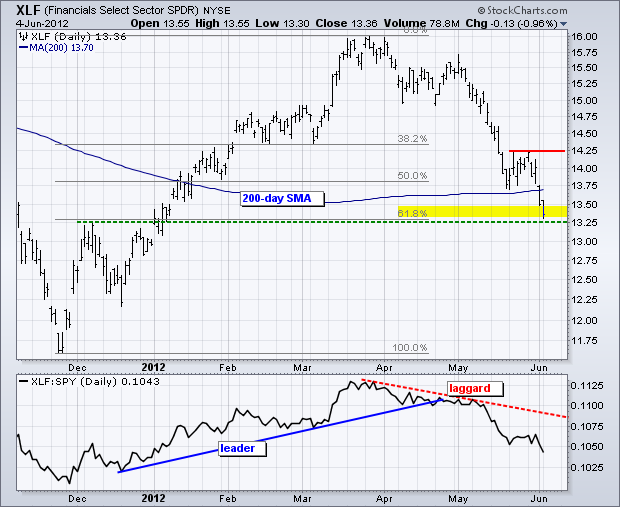
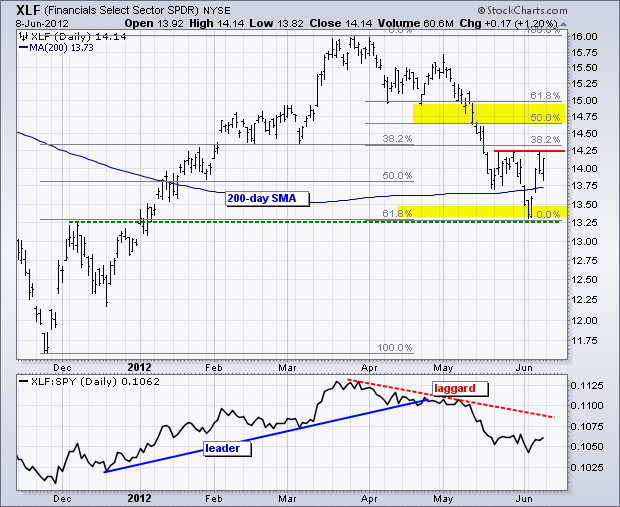
Stocks ended mixed on Monday with mid-caps showing relative weakness and large techs showing relative strength. The sectors were also mixed with five up and four down. The Finance SPDR (XLF) led the losers by falling almost 1%... Read More
Art's Charts June 05, 2012 at 04:47 AM
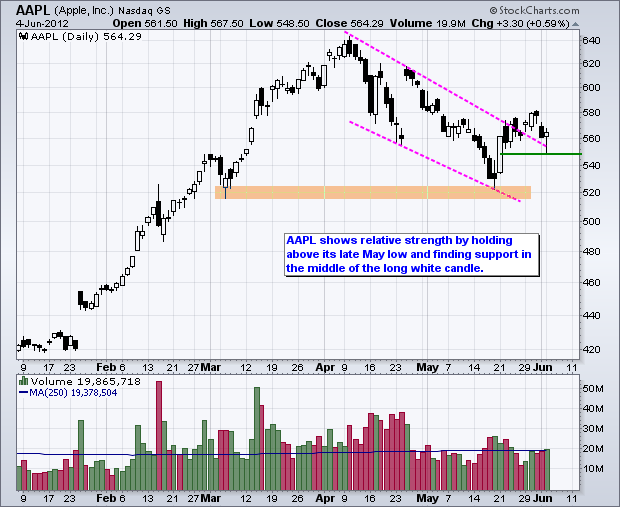
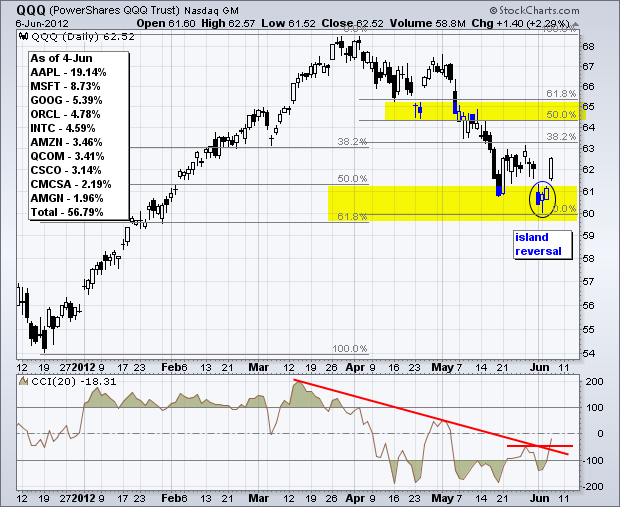
AAPL Shows Relative Strength. AMZN Retraces 50-61.80% of Prior Surge. ORCL Firms Just above Support Zone. Plus $AMGN, $CIEN This commentary and charts-of-interest are designed to stimulate thinking... Read More
Art's Charts June 04, 2012 at 06:03 AM
Friday produced yet another round of economic reports that were below expectations and the stock market moved sharply lower. Even though EU issues may be lurking behind the scenes, don't forget that US economic reports have been falling short for two months now... Read More
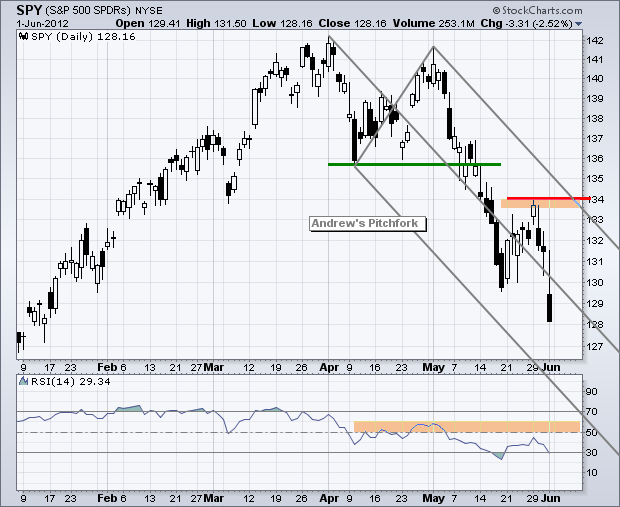
Art's Charts June 01, 2012 at 05:21 AM

Despite a shallow bounce and some firmness the last two weeks, there is no change in the indicator summary. Current conditions remain bearish overall. The major index ETFs and the key sector SPDRs all broke down in May... Read More
Art's Charts June 01, 2012 at 04:03 AM
Stocks were mixed and directionless on Thursday. Concerns in Europe and worse-than-expected economic reports buoyed the bears, while the prospects of further quantitative easing from the European Central Bank (ECB) and Fed put a bid in stocks... Read More