Art's Charts August 31, 2012 at 04:53 AM
The top pickers are circling the wagons as we roll into September, October, the election, the fiscal cliff, a Euro crisis and a Chinese slow down. Even though this is enough to push one to the sidelines, keep in mind that most of this is probably already priced into the market... Read More
Art's Charts August 31, 2012 at 03:46 AM
Stocks pulled back as traders moved aside ahead of Fed Chairman Bernanke's speech at Jackson Hole this morning. Truth be told, I think the three economic reports are more important that his speech, which will probably walk a fine line and repeat the last FOMC policy statement... Read More
Art's Charts August 30, 2012 at 04:41 AM
Trading volume is low, the last two dog days of summer are here, we are heading into a three day weekend and Fed Chairman Bernanke is speaking from Jackson Hole at 10AM tomorrow. The first three items argue for another listless session... Read More
Art's Charts August 30, 2012 at 04:32 AM
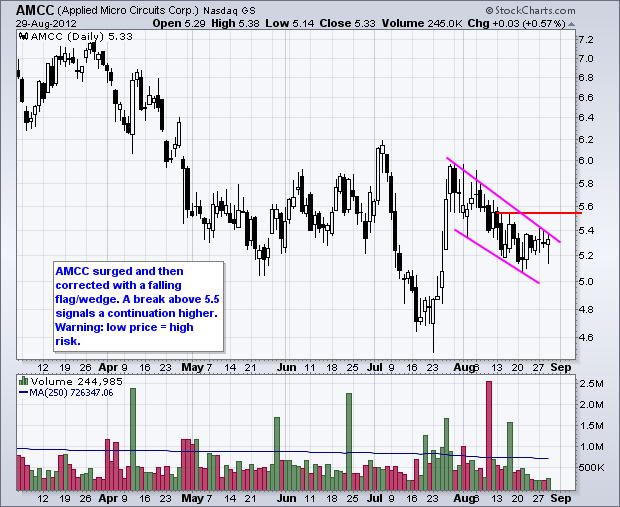
EMC Forms Pennant after Double Bottom Breakout. FISV Recovers after Island Reversal. Plus AMCC, AMAT, FLEX, MSI This commentary and charts-of-interest are designed to stimulate thinking... Read More
Art's Charts August 29, 2012 at 04:32 AM
Stocks remained mixed and directionless on Tuesday. The Dow Industrials SPDR (DIA) and S&P 500 ETF (SPY) edged lower, while the Russell 2000 ETF (IWM) and S&P MidCap 400 SPDR (MDY) edged higher. The latter two were up around a 1/2 percent. Three sectors were up and six were down... Read More
Art's Charts August 28, 2012 at 05:07 AM
Stocks were all mixed up with no place to go on Monday. Techs and small-caps showed some strength as the Nasdaq 100 ETF (QQQ) and Russell 2000 ETF (IWM) edged higher. These miniscule gains were offset by small losses in the S&P 500 ETF (SPY) and the Dow Industrials SPDR (DIA)... Read More
Art's Charts August 28, 2012 at 05:03 AM
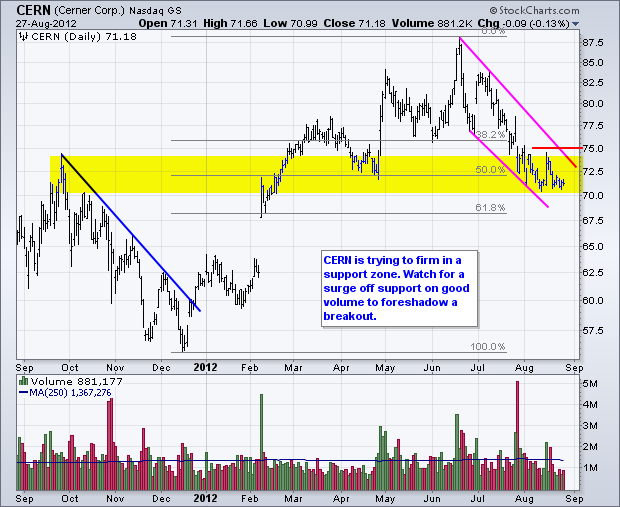
CTXS Forms Flag at Key Retracement. UPS Hits Resistance in Retracement Zone. Plus CERN, FFIV, IMN, JDSU, LIFE, UEC This commentary and charts-of-interest are designed to stimulate thinking... Read More
Art's Charts August 27, 2012 at 06:08 AM
Comments from Fed chairman Bernanke boosted stocks on Friday as the major index ETFs closed with modest gains. Despite Friday's bounce, the major index ETFs closed lower for the week... Read More
Art's Charts August 24, 2012 at 07:13 AM
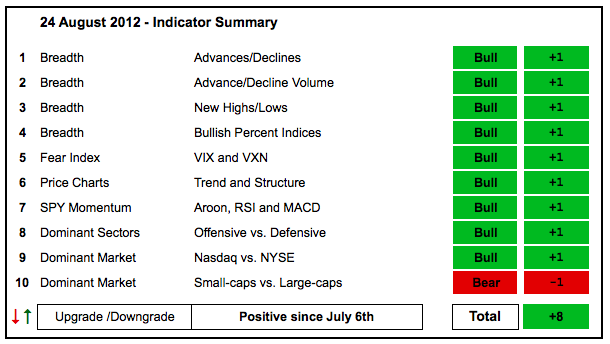
Stockspulled back this week, but the bigger trends remain up and the bulk of the evidence still favors the bulls. Three days of weakness does not a trend change make, especially when stocks were overbought to start the week... Read More
Art's Charts August 24, 2012 at 03:34 AM
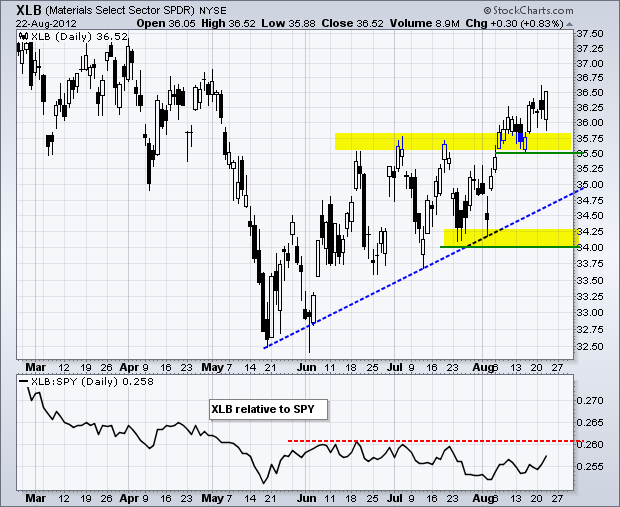
Stocks extended their correction with modest losses in the major index ETFs on Thursday. The Rydex S&P 500 Equal Weight ETF (RSP) led the way lower with a .91% loss. All sectors were down with the Basic Materials SPDR (XLB) and the Energy SPDR (XLE) pacing the losses... Read More
Art's Charts August 23, 2012 at 05:43 AM
Stocks went on a wild ride Wednesday and finished the day mixed. Selling pressure dominated the morning, but hints of QE3 brought out the buyers in the afternoon. The Nasdaq 100 ETF (QQQ) led the advancers with a ... Read More
Art's Charts August 23, 2012 at 05:39 AM
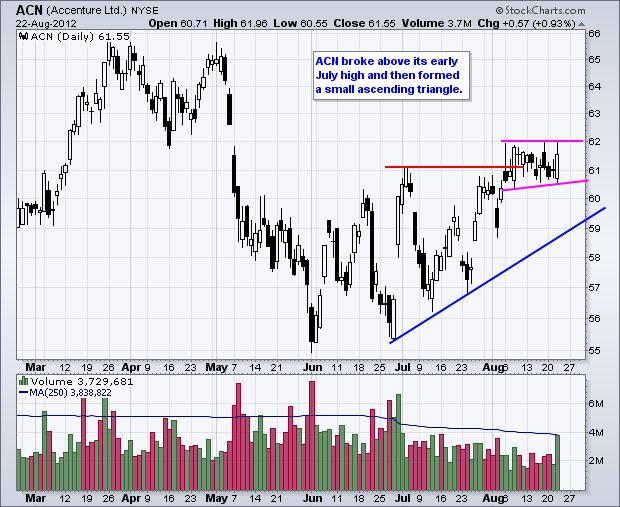
ACN Forms Small Ascending Triangle Near Resistance. MRO Surges on Big Volume. Plus ACI, CHK, MRO and WFT This commentary and charts-of-interest are designed to stimulate thinking... Read More
Art's Charts August 22, 2012 at 04:34 AM
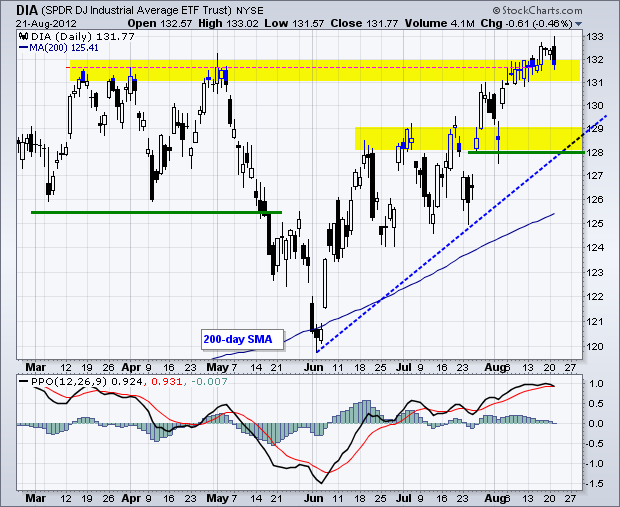
With the old pop and drop on Tuesday, a number of bearish engulfing patterns formed on the price charts. DIA, QQQ and SPY all formed bearish engulfing patterns... Read More
Art's Charts August 21, 2012 at 05:01 AM
Stocks came under selling pressure from profit taking and renewed concerns in the Eurozone. Given the advance of the last few weeks, a little consolidation or even a correction would be normal. The major index ETFs finished slightly lower... Read More
Art's Charts August 21, 2012 at 04:57 AM
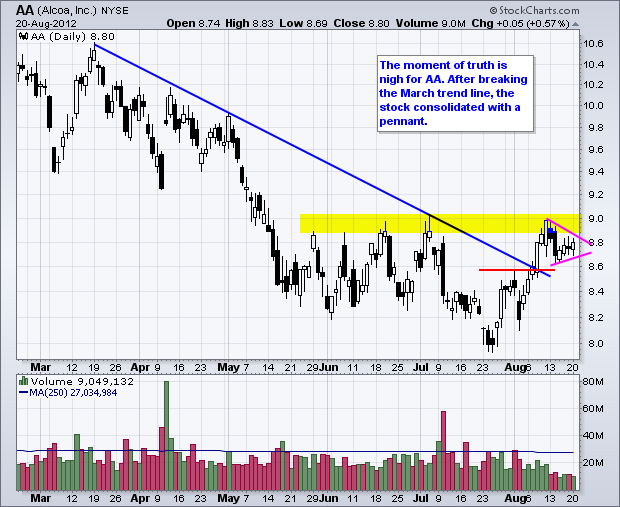
AA Forms Pennant Near Resistance. CPN Surges off Key Retracement with Volume. Plus ALK, AVP, JPM, LRCX, TEVA This commentary and charts-of-interest are designed to stimulate thinking... Read More
Art's Charts August 20, 2012 at 05:37 AM
Stocks meandered on Friday and got a lift in the final hour to finish the week on a positive note. The Russell 2000 ETF (IWM) led the way with a .70% gain. The Dow Industrials SPDR (DIA) lagged with a .11% loss. Five of the nine sectors were higher... Read More
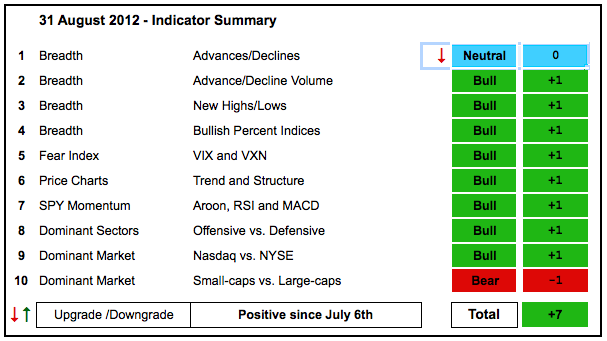
Art's Charts August 17, 2012 at 06:28 AM
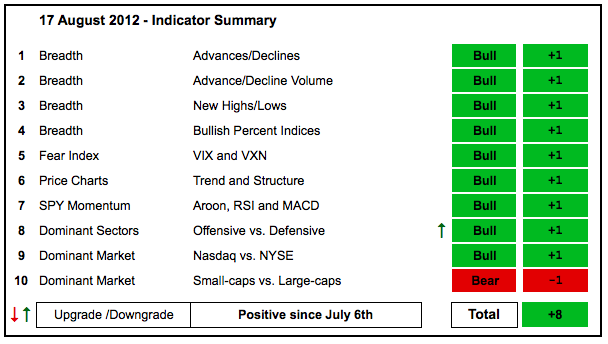
With fresh highs in the major index ETFs this week, the indicator groups held their positive ratings and there was even an upgrade... Read More
Art's Charts August 17, 2012 at 04:43 AM
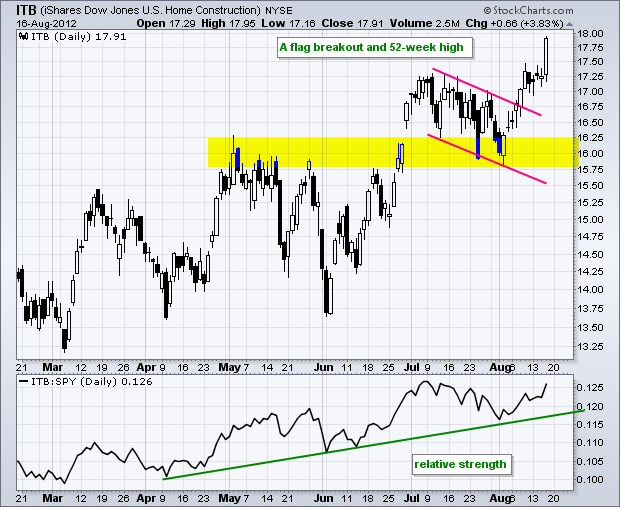
Stocks caught a bid on Thursday and closed modestly higher. The Nasdaq 100 ETF (QQQ) and Russell 2000 ETF (IWM) led the way by gaining over 1%. All sectors were up with technology and materials scoring the biggest gains. A big gain in the Home Construction iShares (+3... Read More
Art's Charts August 16, 2012 at 05:56 AM
Stocks continued their meandering ways on Wednesday, but the major index ETFs managed to close with gains. The Russell 2000 ETF (IWM) led the way with a .88% gain and the S&P 100 ETF (OEF) lagged with a .02% gain... Read More
Art's Charts August 16, 2012 at 05:45 AM
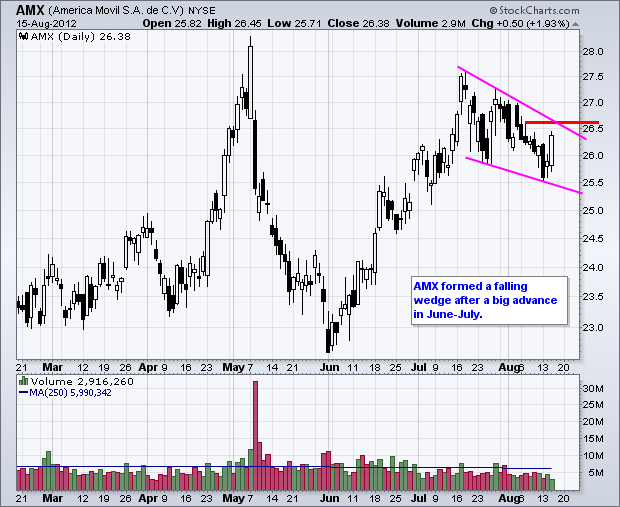
ATVI Recovers after Support Break. FAST Forms Bull Flag after Breakout. Plus AMX, HCA, SNDK This commentary and charts-of-interest are designed to stimulate thinking. This analysis is not a recommendation to buy, sell, hold or sell short any security (stock ETF or otherwise)... Read More
Art's Charts August 15, 2012 at 05:31 AM
Stocks continued their drift with a small surge on the open and then a drift lower throughout the day. Basically, the major index ETFs drifted back to their prior closed and finished the day virtually unchanged. Trading has been listless for 5-6 days now... Read More
Art's Charts August 14, 2012 at 07:32 AM
The major index ETFs moved lower in early trading on Monday, but quickly firmed and advanced in afternoon trading. Even though the change from Friday's close to Monday's close was minimal, the ability to recover and close strong is a positive sign... Read More
Art's Charts August 14, 2012 at 07:27 AM
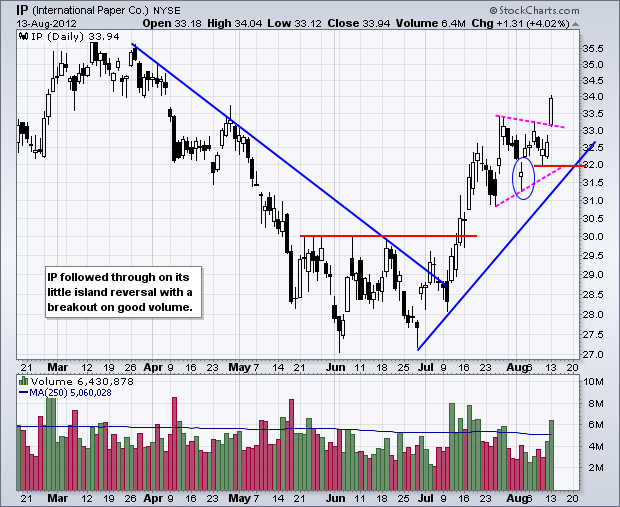
IP Follows Through on Island Reversal. Bollinger Bands Narrow for SCMR. Plus MCK, SYK and TIBX This commentary and charts-of-interest are designed to stimulate thinking. This analysis is not a recommendation to buy, sell, hold or sell short any security (stock ETF or otherwise)... Read More
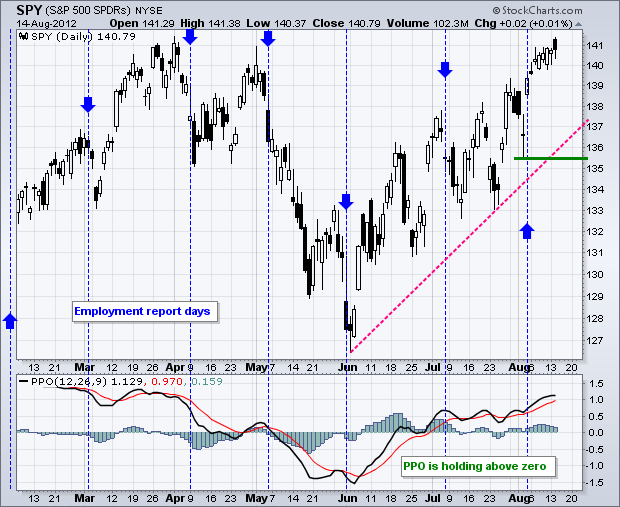
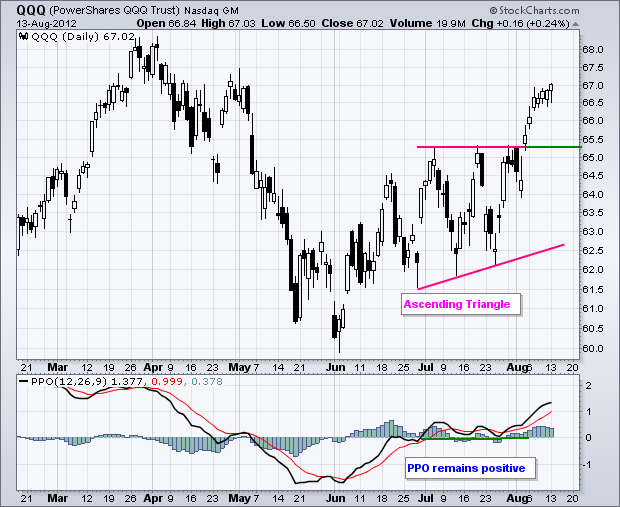
Art's Charts August 12, 2012 at 09:38 AM
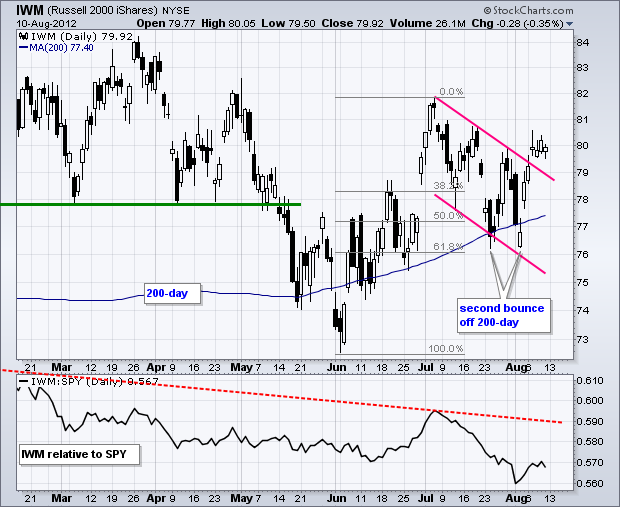
Stocks continued higher last week and closed near their highs for the week. The Nasdaq 100 ETF broke resistance from its July highs and this breakout is holding. The Russell 2000 ETF broke falling channel resistance and this breakout is holding... Read More
Art's Charts August 09, 2012 at 07:03 AM
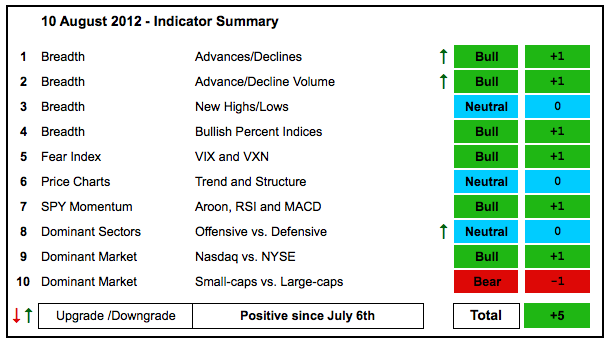
With last Friday's surge and continued strength this week, the indicator summary improved as three groups were upgraded. I upgraded the AD Lined because the NYSE AD Line hit a new high. The AD Volume Lines were upgraded because they broke their mid July highs... Read More
Art's Charts August 09, 2012 at 06:58 AM
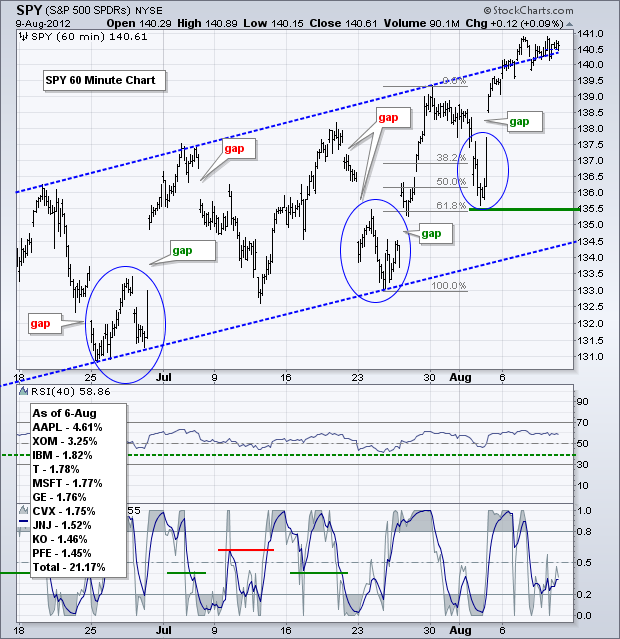
No commentary, just charts worth a 1000 words... Read More
Art's Charts August 09, 2012 at 02:14 AM
Stocks turned indecisive on Wednesday as the major index ETFs closed mixed. The Dow Industrials SPDR (DIA) edged .13% lower, while the S&P 500 ETF (SPY) edged .12% higher. The sectors were also mixed with the Consumer Discretionary SPDR (XLY) losing ... Read More
Art's Charts August 09, 2012 at 02:05 AM
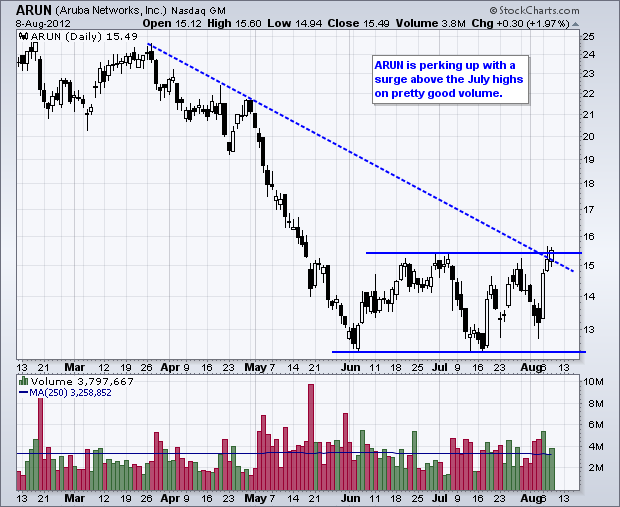
ARUN Surges to Resistance. DLTR Breaks Falling Wedge Resistance. PLCE Consolidates after Big Move. Plus CPRT, LEN, SSP This commentary and charts-of-interest are designed to stimulate thinking... Read More
Art's Charts August 07, 2012 at 09:26 AM
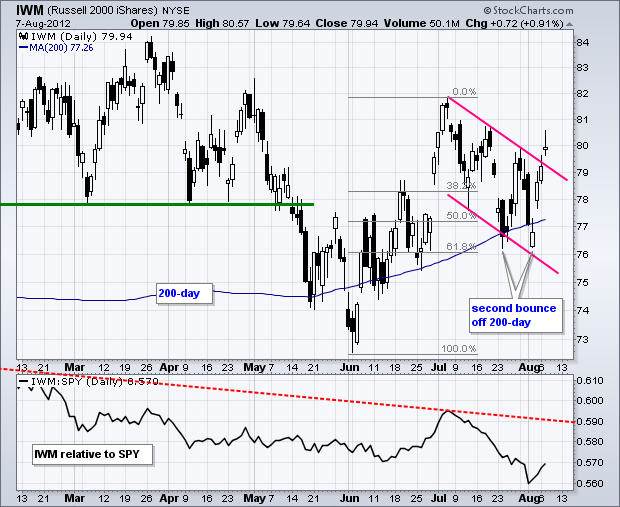
Stocks extended their gains for the third day running. Since gapping up on Friday morning, the major index ETFs continued their advance with a slower zigzag. Even though this means less upside momentum, there is clearly more upside momentum than downside momentum... Read More
Art's Charts August 07, 2012 at 01:25 AM
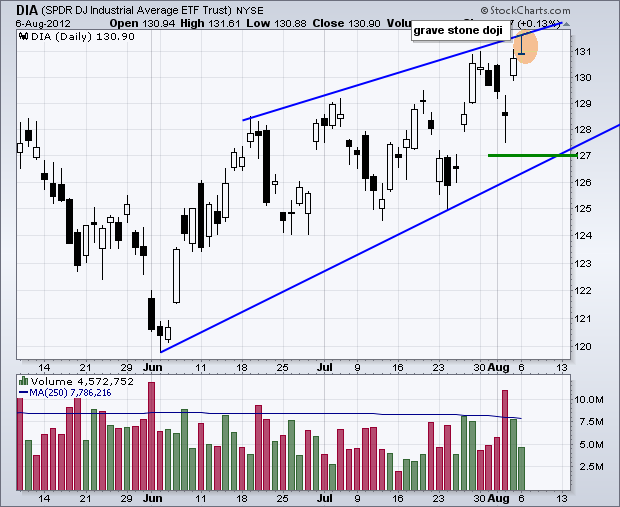
Stocks continued higher on Monday, but late selling pressure hit in the final fifteen minutes. As a result of this late selling pressure, the Dow Industrials SPDR (DIA) formed a gravestone doji with a long upper shadow... Read More
Art's Charts August 07, 2012 at 01:15 AM
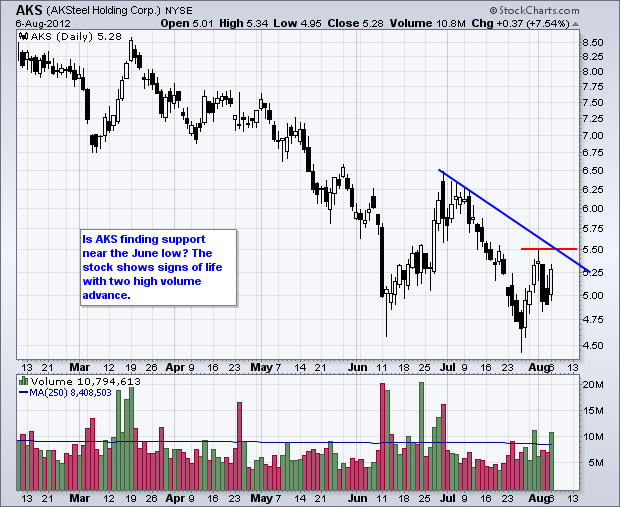
$AKS Bounces with Good Volume. $KBH Forms Falling Wedge. $TEVA Traces out Bullish Engulfing Pattern. This commentary and charts-of-interest are designed to stimulate thinking... Read More
Art's Charts August 05, 2012 at 04:26 AM
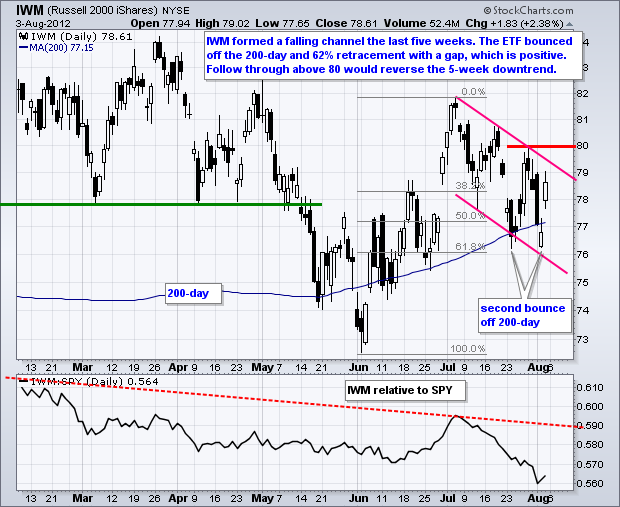
There it is again. Stocks were pushed down early in the week, but positive news on employment and the ISM Services Index produced a very sharp rally on Friday. Small-caps led the surge as the Russell 2000 ETF (IWM) gained over 2%... Read More
Art's Charts August 03, 2012 at 05:45 AM
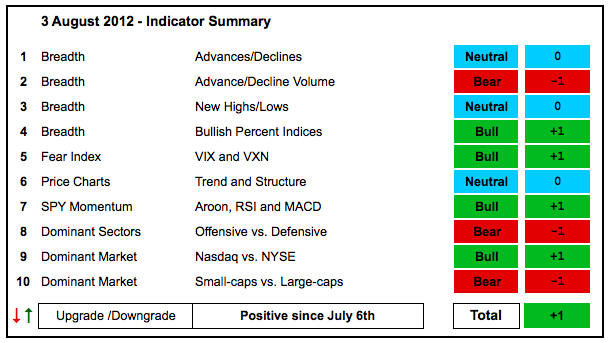
There is no change in the indicator summary. On the positive side, the NYSE AD Line is trading near a 52-week high, NYSE Net New Highs are positive and eight of the nine sector Bullish Percent Indices are above 50%... Read More
Art's Charts August 03, 2012 at 03:42 AM
Stocks moved sharply lower on Thursday's open when it became clear that European Central Bank (ECB) president Mario Draghi was not quite ready to act. Nevertheless, stocks firmed at midday and then edged off their lows in the afternoon... Read More
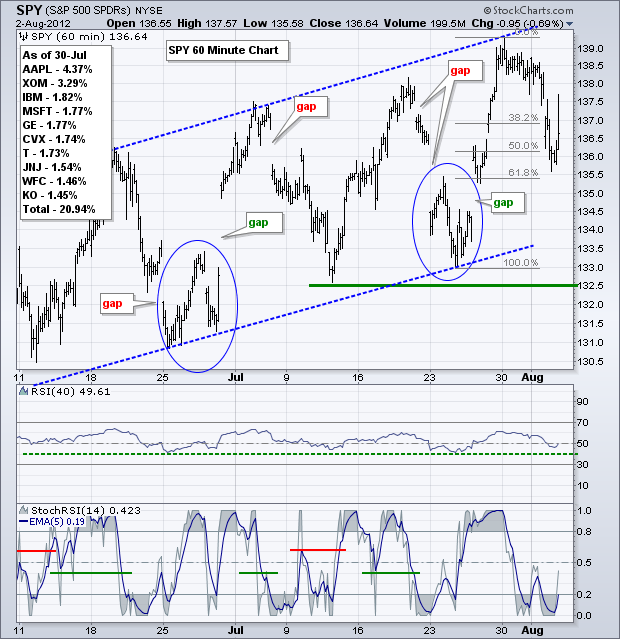
Art's Charts August 02, 2012 at 04:53 AM
The S&P 500 ETF (-.36%) and Dow Industrials SPDR (-.19%) edged lower on Wednesday, but the Russell 2000 ETF (-1.65%) and S&P MidCap 400 SPDR (1.05%) moved decisively lower. Again, relative weakness in small-caps and mid-caps remains a major concern in the market right now... Read More
Art's Charts August 02, 2012 at 04:47 AM
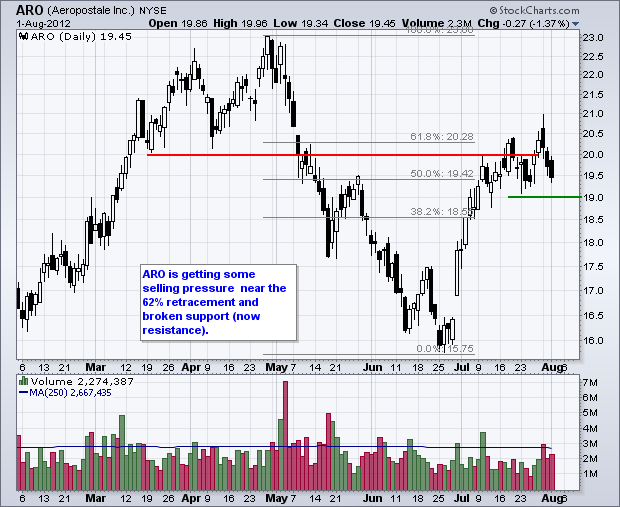
ARO Stalls at 61.80% Retracement. FISV Forms Island Reversal. HRB Breaks Flag Support with High Volume. Plus ASEI, BBBY, LIFE This commentary and charts-of-interest are designed to stimulate thinking... Read More
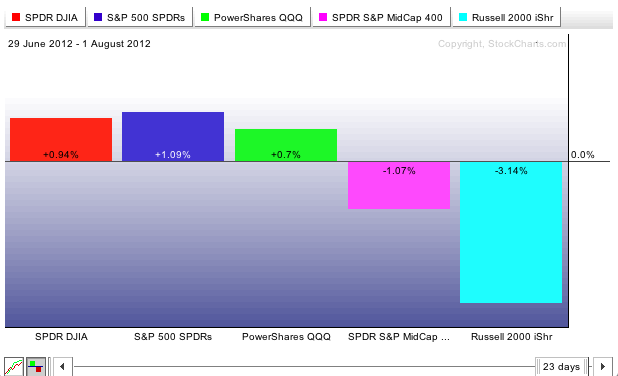
Art's Charts August 01, 2012 at 04:24 AM
Stocks continued to edge lower on Tuesday with small-caps and mid-caps leading the way. The Russell 2000 ETF lost .70% and the S&P MidCap 400 SPDR declined just over 1%. Eight of the nine sectors were down with the Technology SPDR bucking the trend. However, XLK gained just ... Read More