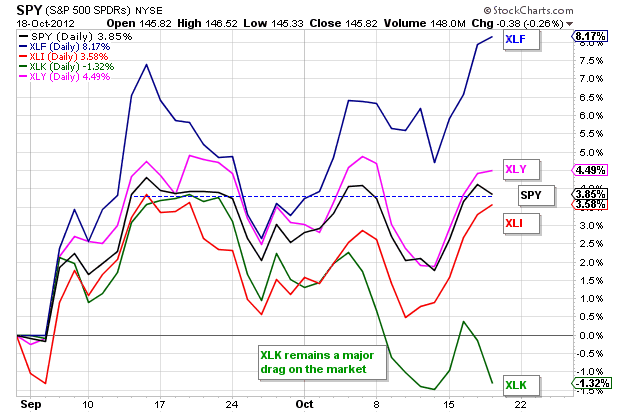
Tech stocks got whacked again as Google and Microsoft came up short on their earnings reports. The trend in worse-than-expected earnings continues, especially for tech companies and especially for tech companies tied to the PC (Microsoft, Intel, AMD, Checkpoint, HP). The Technology SPDR (XLK) was already underperforming the broader market and this underperformance increased with Thursday's weakness. As the PerfChart below shows, XLK is now down 1.32% since the beginning of September. The Finance SPDR (XLF) is offsetting this weakness with an 8.17% gain. Meanwhile the Technology SPDR (XLK) and the Consumer Discretionary SPDR (XLY) are performing in line.

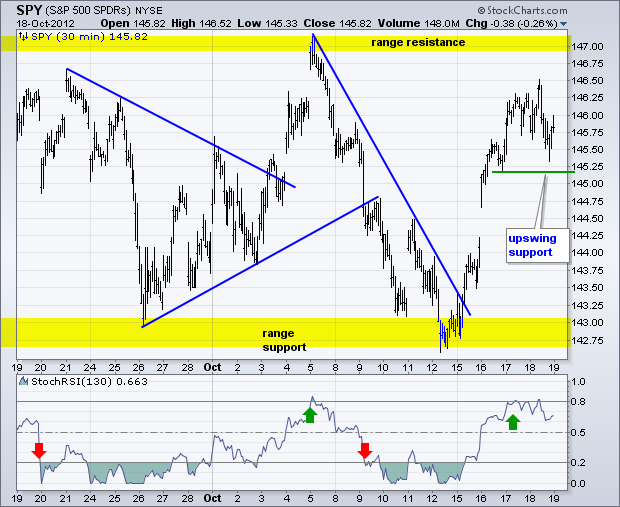
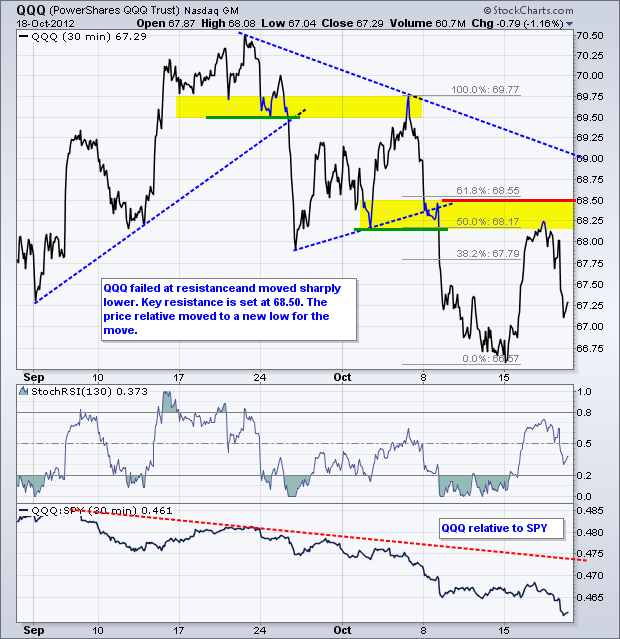
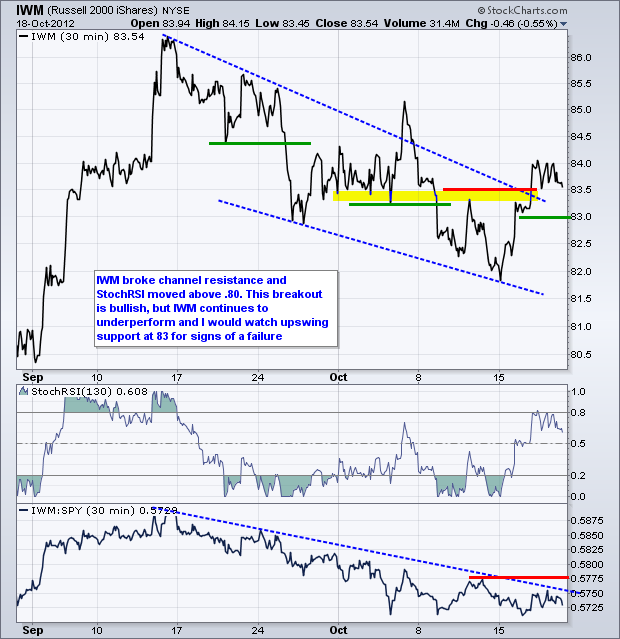
The S&P 500 ETF (SPY) has been stuck in a trading range since mid September. Thursday's close is near the 13-Sept close and the ETF has gone nowhere the last five weeks. This could be a consolidation within a bigger uptrend, but it is hard to bet with the bulls when the technology sector is so weak. Also note that small-caps have been lagging since mid September. On the 30-minute chart above, SPY has been swinging from support to resistance the last few weeks. Even though the current swing is up, resistance is nigh and the ETF is stalling in the 145.75 area. The Tuesday afternoon low and Thursday afternoon low combine to mark support in the 145.25 area. A break below these lows would reverse the upswing and target another support test. Support may not hold this time.
**************************************************************************
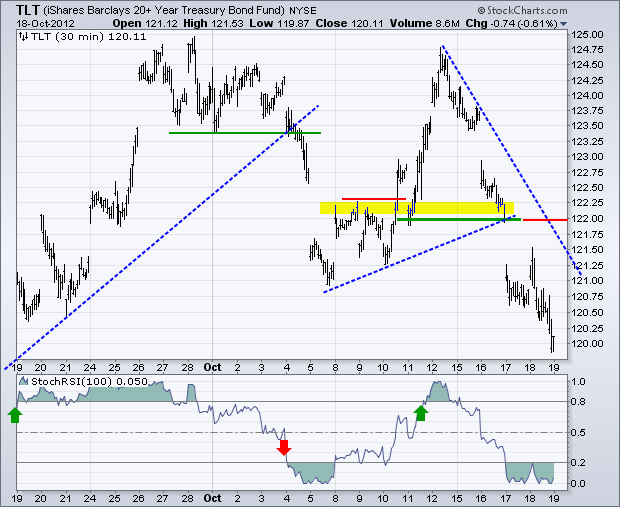
Wow, stocks, the Euro and treasuries moved lower on Thursday. Something is not quite right here. Treasuries should move higher when stocks and the Euro are weak. Perhaps treasuries are not that worried about technology stocks. The 20+ Year T-Bond ETF (TLT) remains in a downswing and I am moving key resistance to 122. The five day trend line and broken support mark resistance here. A move above this level would reverse the short-term downtrend and this would be bearish for stocks overall.
**************************************************************************
The US Dollar Fund (UUP) got a pretty good bounce on Thursday, but remains in a downswing as well. I am lowering downswing resistance to 21.80, which is based on the eight day trend line and broken support. A move above this level would reverse the downswing, but not the medium-term downtrend, which would require a break above the September-October highs.

**************************************************************************
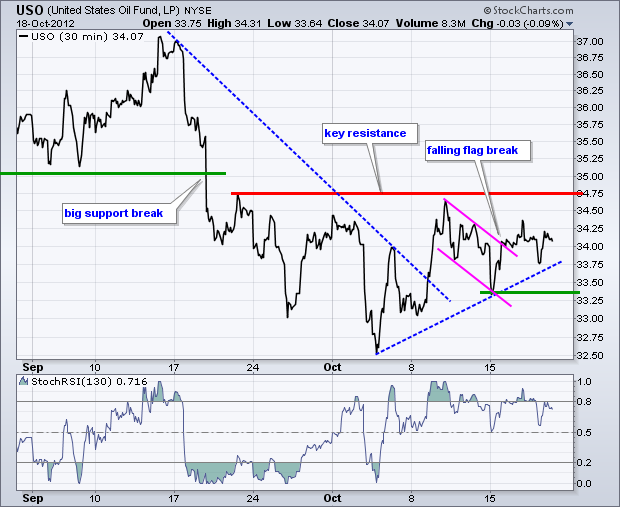
No change. The US Oil Fund (USO) remains with a falling flag breakout, but this breakout is not looking healthy. Even though the Dollar declined and stocks advanced the last three days, USO remains below key resistance and did not react the last two days. A follow through break above 34.75 is needed to complete this trend reversal. I will mark support at 33.25 and a break below this level would signal a continuation of the September decline.
**************************************************************************
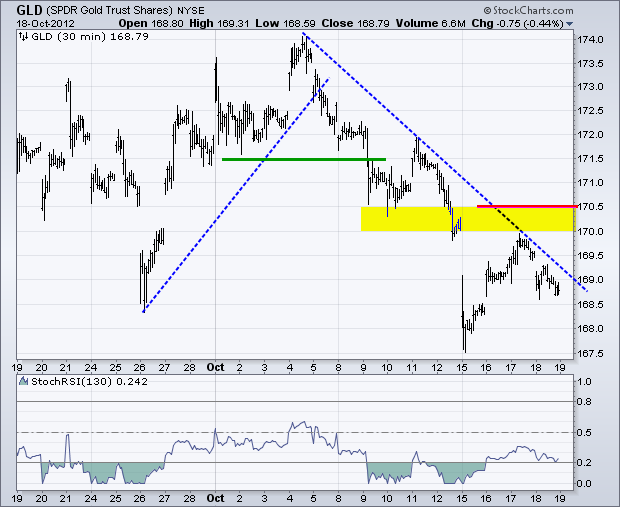
No change. The Gold SPDR (GLD) rebounded as the Dollar fell this week. However, this rebound is nearing a moment-of-truth already. Notice that broken support turns into resistance in the 170.5 area. Resistance here is further confirmed by the early October trend line. A break above 170.5 is needed to reverse this short-term downtrend.
**************************************************************************
Key Reports and Events:
Fri – Oct 19 – 09:00 – EU Summit
Fri - Oct 19 - 10:00 - Existing Home Sales
Charts of Interest: Tuesday and Thursday
This commentary and charts-of-interest are designed to stimulate thinking. This analysis is not a recommendation to buy, sell, hold or sell short any security (stock ETF or otherwise). We all need to think for ourselves when it comes to trading our own accounts. First, it is the only way to really learn. Second, we are the only ones responsible for our decisions. Think of these charts as food for further analysis. Before making a trade, it is important to have a plan. Plan the trade and trade the plan. Among other things, this includes setting a trigger level, a target area and a stop-loss level. It is also important to plan for three possible price movements: advance, decline or sideways. Have a plan for all three scenarios BEFORE making the trade. Consider possible holding times. And finally, look at overall market conditions and sector/industry performance.


**************************************************************************
Wow, stocks, the Euro and treasuries moved lower on Thursday. Something is not quite right here. Treasuries should move higher when stocks and the Euro are weak. Perhaps treasuries are not that worried about technology stocks. The 20+ Year T-Bond ETF (TLT) remains in a downswing and I am moving key resistance to 122. The five day trend line and broken support mark resistance here. A move above this level would reverse the short-term downtrend and this would be bearish for stocks overall.

**************************************************************************
The US Dollar Fund (UUP) got a pretty good bounce on Thursday, but remains in a downswing as well. I am lowering downswing resistance to 21.80, which is based on the eight day trend line and broken support. A move above this level would reverse the downswing, but not the medium-term downtrend, which would require a break above the September-October highs.

**************************************************************************
No change. The US Oil Fund (USO) remains with a falling flag breakout, but this breakout is not looking healthy. Even though the Dollar declined and stocks advanced the last three days, USO remains below key resistance and did not react the last two days. A follow through break above 34.75 is needed to complete this trend reversal. I will mark support at 33.25 and a break below this level would signal a continuation of the September decline.

**************************************************************************
No change. The Gold SPDR (GLD) rebounded as the Dollar fell this week. However, this rebound is nearing a moment-of-truth already. Notice that broken support turns into resistance in the 170.5 area. Resistance here is further confirmed by the early October trend line. A break above 170.5 is needed to reverse this short-term downtrend.

**************************************************************************
Key Reports and Events:
Fri – Oct 19 – 09:00 – EU Summit
Fri - Oct 19 - 10:00 - Existing Home Sales
Charts of Interest: Tuesday and Thursday
This commentary and charts-of-interest are designed to stimulate thinking. This analysis is not a recommendation to buy, sell, hold or sell short any security (stock ETF or otherwise). We all need to think for ourselves when it comes to trading our own accounts. First, it is the only way to really learn. Second, we are the only ones responsible for our decisions. Think of these charts as food for further analysis. Before making a trade, it is important to have a plan. Plan the trade and trade the plan. Among other things, this includes setting a trigger level, a target area and a stop-loss level. It is also important to plan for three possible price movements: advance, decline or sideways. Have a plan for all three scenarios BEFORE making the trade. Consider possible holding times. And finally, look at overall market conditions and sector/industry performance.

About the author:
Arthur Hill, CMT, is the Chief Technical Strategist at TrendInvestorPro.com. Focusing predominantly on US equities and ETFs, his systematic approach of identifying trend, finding signals within the trend, and setting key price levels has made him an esteemed market technician. Arthur has written articles for numerous financial publications including Barrons and Stocks & Commodities Magazine. In addition to his Chartered Market Technician (CMT) designation, he holds an MBA from the Cass Business School at City University in London.
Learn More