Art's Charts December 28, 2012 at 07:24 AM
The bulk of the evidence remains bullish, but I am concerned that the major index ETFs may be forming lower highs. With the decline over the last six days, SPY and DIA peaked below their September highs and lower highs could be forming... Read More
Art's Charts December 28, 2012 at 04:51 AM
Ladies and gentlemen, the fiscal cliff is a farce built up by the media and the politicians. It is not a cliff, but rather a slope that can be remedied in January, February or even March. Of course, the longer the slope extends, the worse for the economy and the stock market... Read More
Art's Charts December 26, 2012 at 12:08 PM
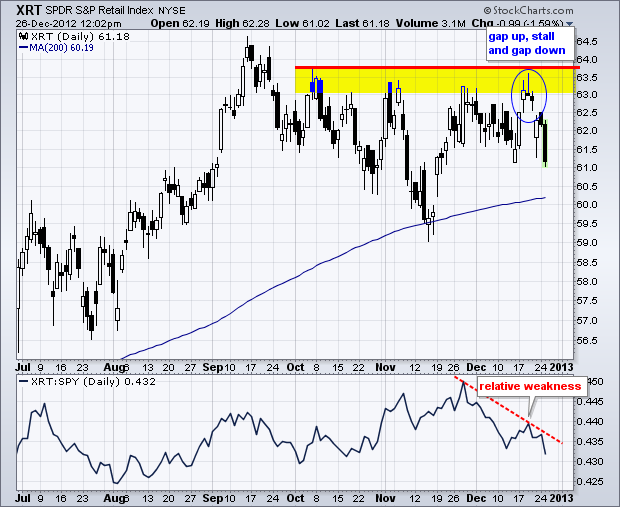
The Retail SPDR (XRT) reversed near resistance with a gap up, stall and gap down. This sequence is also known as an island reversal. In addition to the reversal at resistance, notice that XRT shows relative weakness as the price relative moved below its mid December low... Read More
Art's Charts December 26, 2012 at 06:08 AM
Programming note: I will be taking off December 27th and 31st. Art's charts and the Market Message will be updated on Wednesday and Friday this week, and Wednesday (Jan-2) next week... Read More
Art's Charts December 21, 2012 at 05:55 AM
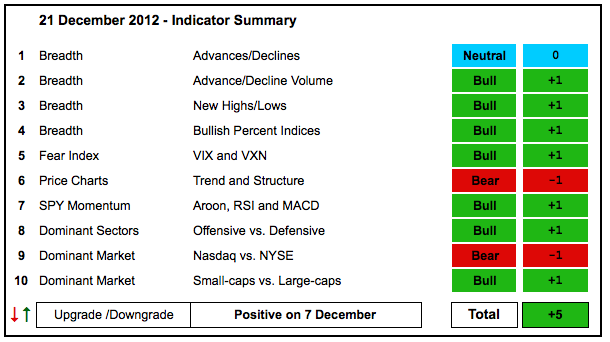
Things were looking up until the fiscal cliff hit a roadblock. Stock futures are pointing to a sharply lower open and it could be a bumpy ride until yearend. The indicator summary remains bullish overall with new highs in the NYSE AD Line and AD Volume Line leading the charge... Read More
Art's Charts December 21, 2012 at 04:40 AM
Programming note: I will be taking off December 24, 27 and 31. Art's charts and the Market Message will be updated on Wednesday and Friday next week... Read More
Art's Charts December 20, 2012 at 06:27 AM
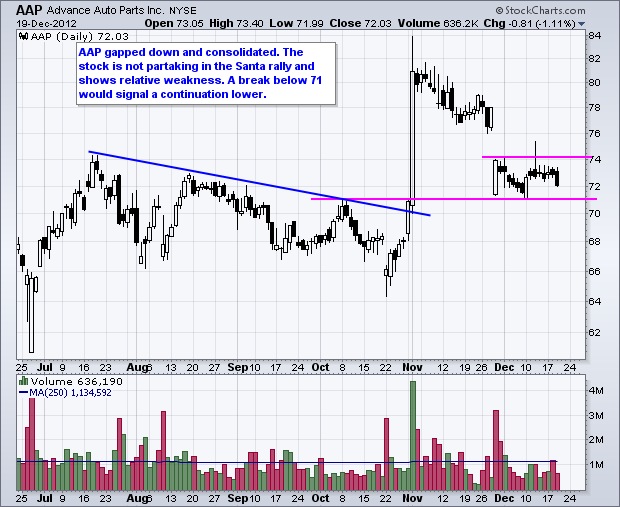
AAP Consolidates after Gap Down. HAS Falls Five Straight Days. Plus AZO, BCR, CB, LUB, ROL, XOM This commentary and charts-of-interest are designed to stimulate thinking. This analysis is not a recommendation to buy, sell, hold or sell short any security (stock ETF or otherwise)... Read More
Art's Charts December 20, 2012 at 05:51 AM
Stocks edged lower during the day and then took a hit in the final hour. The S&P 500 ETF (SPY) fell .74% and the Nasdaq 100 ETF (QQQ) declined .43% on the day. The losses were modest and the market was ripe for some profit taking... Read More
Art's Charts December 19, 2012 at 04:04 AM
The market brushed off the fiscal cliff BS as the Santa bulls got into high gear on Tuesday. All of the major index ETFs advanced over 1% with the Nasdaq 100 Equal-Weight ETF (QQEW) leading the way (+1.52%). Small-caps were also strong with the Russell 2000 ETF (IWM) up 1... Read More
Art's Charts December 18, 2012 at 05:05 AM
The Santa Claus rally continued on Monday with the major index ETFs scoring nice gains. The Nasdaq 100 ETF (QQQ) led the way with a 1.33% rise. All sectors were up with the consumer discretionary, technology, finance and utilities sectors leading the way... Read More
Art's Charts December 18, 2012 at 04:58 AM
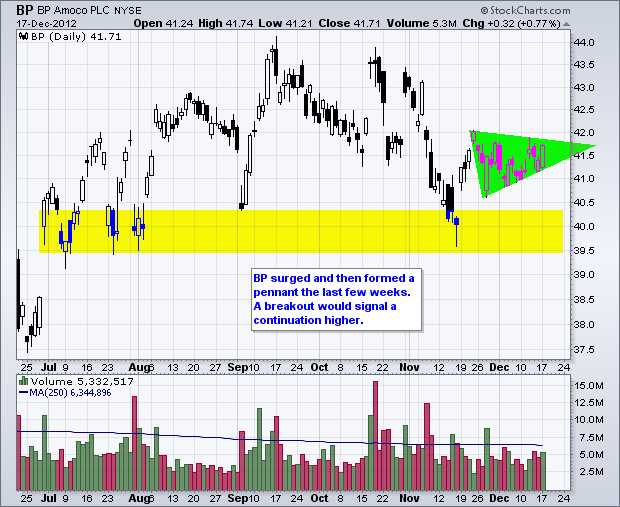
BP Forms Triangle Consolidation, CHS Bounces off Support. Plus CQP, COH, FITB, USB This commentary and charts-of-interest are designed to stimulate thinking. This analysis is not a recommendation to buy, sell, hold or sell short any security (stock ETF or otherwise)... Read More
Art's Charts December 17, 2012 at 04:41 AM
Trading could get real tricky (volatile) has we head into the fiscal-cliff endgame and holiday season. First, the markets will become extra sensitive to the news flow out of Washington over the next two weeks... Read More
Art's Charts December 14, 2012 at 06:09 AM
Stocks extended their uptrends on Monday-Tuesday, but fell back after the Fed meeting and declined on Thursday. Even though a post-Fed decline may seem negative, it could be just a little buy-the-rumor and sell-the-news at work... Read More
Art's Charts December 14, 2012 at 05:14 AM
Stocks retreated after the Fed announcement. Of course, the fiscal cliff deadlock got the blame. Never mind that the S&P 500 was up some 6% from its mid November lows and ripe for a pullback or consolidation... Read More
Art's Charts December 13, 2012 at 05:18 AM
Stocks were all over the place on Wednesday. The major index ETFs opened strong, pulled back in the late morning, surged after the Fed announcement and pulled back again in the final hour... Read More
Art's Charts December 13, 2012 at 05:07 AM
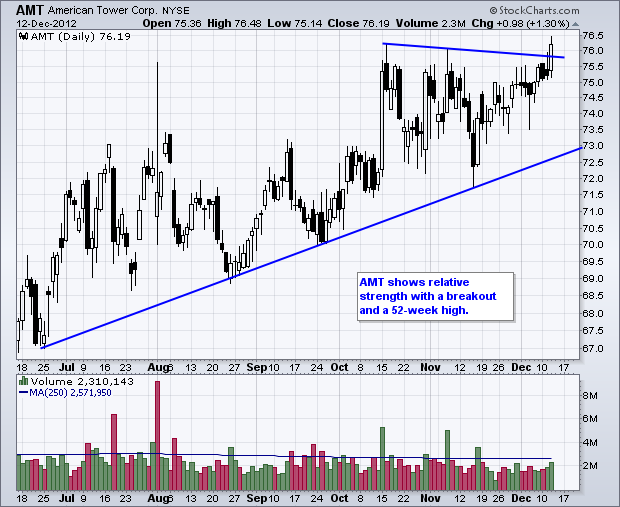
AMT Breaks out to a 52-week High. CCL Forms Ascending Triangle within Uptrend. Plus DHI, M, STLD This commentary and charts-of-interest are designed to stimulate thinking... Read More
Art's Charts December 12, 2012 at 04:15 AM
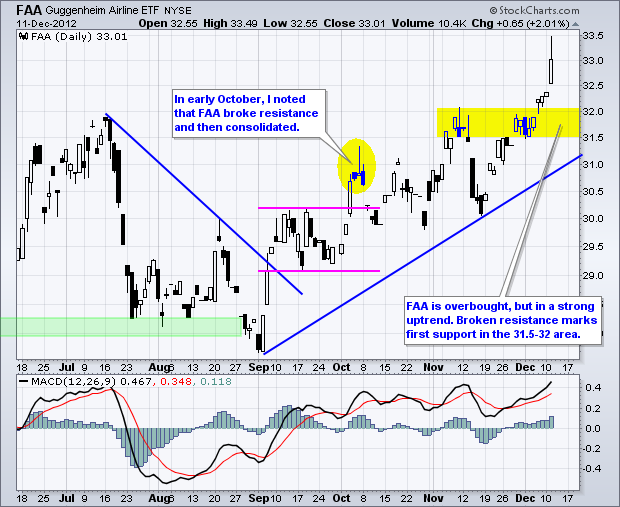
The bulls kept up the pressure on Tuesday with the technology sector leading the charge. The Semiconductor SPDR (XSD) led tech stocks with a 2.71% surge. There was also strength in the Airline ETF (FAA), which advanced 2% and hit a new 52-week high (intraday)... Read More
Art's Charts December 11, 2012 at 03:55 AM
Stocks edged higher in mixed trading. The major index ETFs ended the day with small gains, but the sectors were split... Read More
Art's Charts December 11, 2012 at 03:49 AM
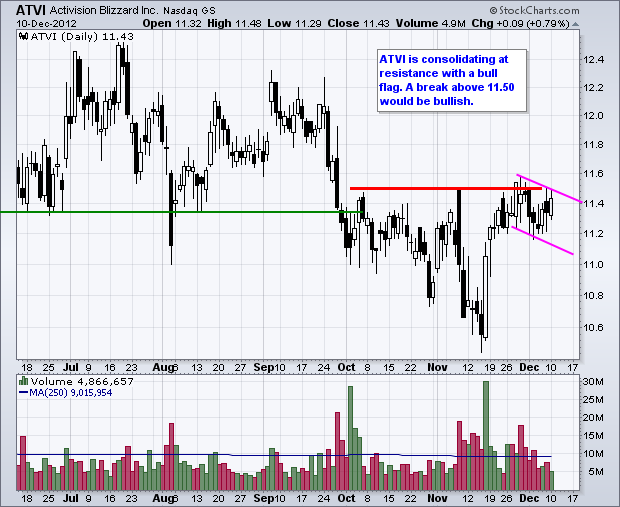
ATVI Forms Bull Flag at Resistance. CHRW Consolidates with Triangle. Plus BMY, BSX, CRM, MDR, VIP This commentary and charts-of-interest are designed to stimulate thinking... Read More
Art's Charts December 10, 2012 at 04:59 AM
Stocks remain dazed and confused. After falling sharply the first two weeks of November, stocks bottomed in mid November and surged the next two weeks. These gains wiped out the early November losses and made it as if November never really happened... Read More
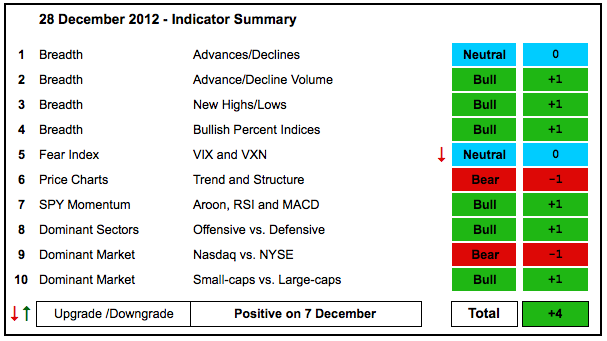
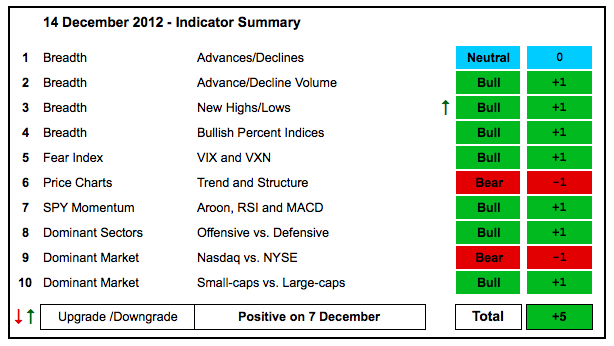
Art's Charts December 07, 2012 at 04:10 AM
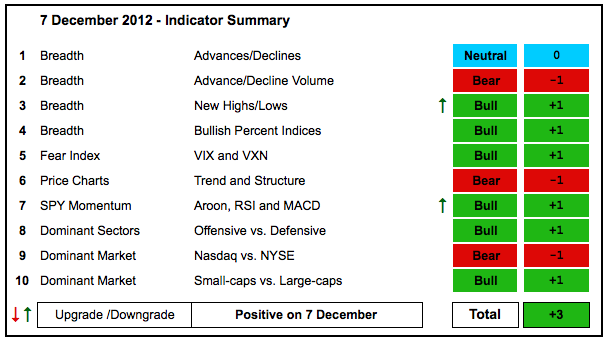
Stocks held their gains with consolidations this week and two upgrades pushed the indicator summary back into positive territory. Nasdaq and NYSE Net New Highs turned bullish again. Nasdaq Net New Highs are not as strong as NYSE Net New Highs though... Read More
Art's Charts December 07, 2012 at 03:19 AM
Stocks will simply not give up the bid or the hope of a fiscal cliff solution. The major index ETFs became short-term oversold last week and pretty much consolidated this week. The Russell 2000 ETF (IWM) and the S&P MidCap 400 SPDR (MDY) held up the best with flat consolidations... Read More
Art's Charts December 06, 2012 at 04:43 AM
Stocks continued to drift on Wednesday with the major index ETFs finishing mixed. The Dow Industrials SPDR (DIA) advanced .66% as the Nasdaq 100 ETF (QQQ) plunged 1.11%. Apple led the way lower for QQQ. Note that the Nasdaq 100 Equal-Weight ETF (QQEW) was up ... Read More
Art's Charts December 06, 2012 at 04:32 AM
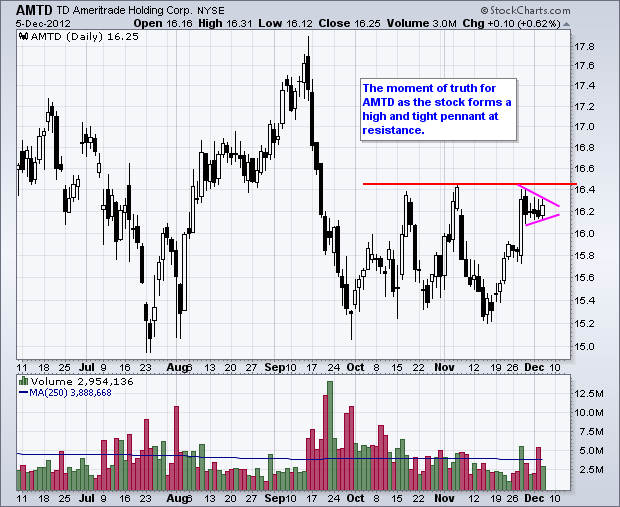
AMTD Forms a High and Tight Pennant. CERN Consolidates after Massive Gap. Plus BTU, JOY, LSI, SYMC This commentary and charts-of-interest are designed to stimulate thinking... Read More
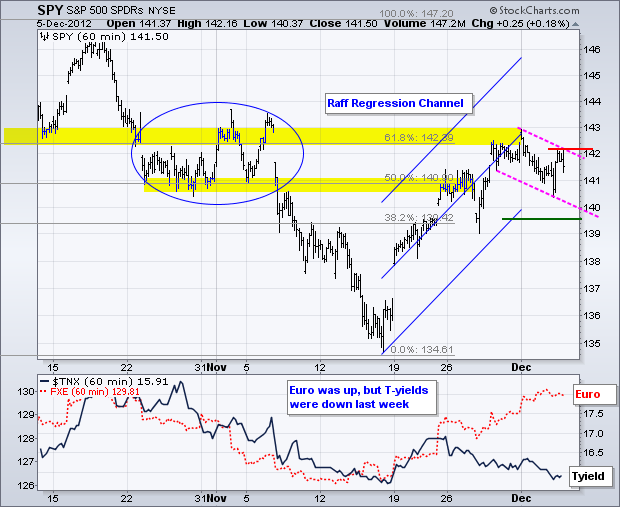
Art's Charts December 05, 2012 at 05:19 AM
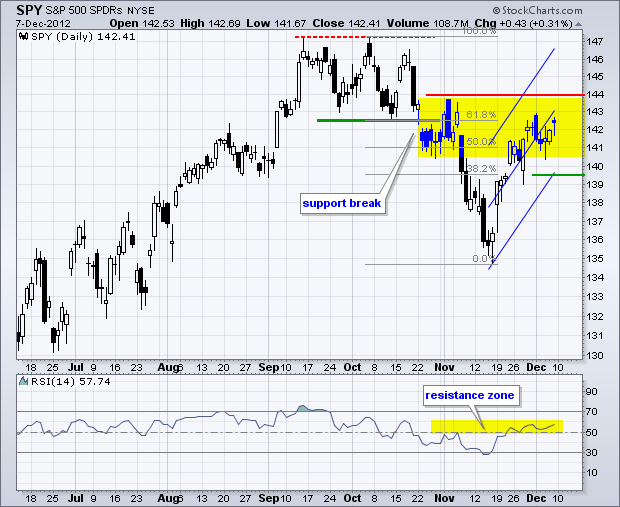
After a sharp advance the prior two weeks, stocks became short-term overbought and stalled the last two days. Resistance levels from prior consolidations and key retracements were also evident on the daily charts... Read More
Art's Charts December 04, 2012 at 06:23 AM
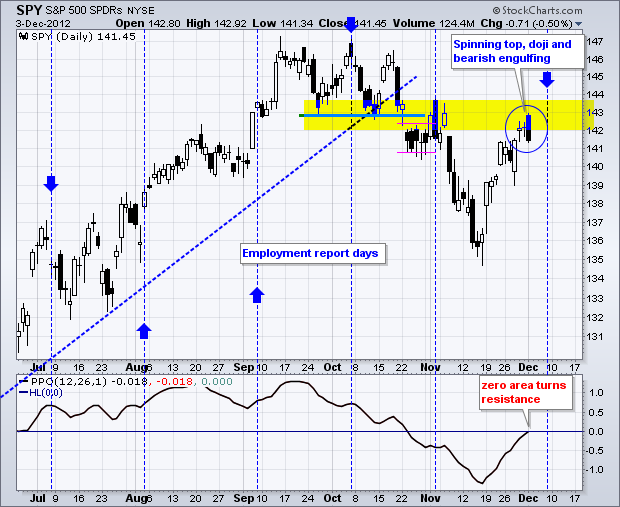
It was drop and pop last Wednesday as stocks opened weak and then rallied. Monday was different as stocks opened strong and then sold off. The S&P 500 was up just over 1/2% in early trading, but fell after the ISM Manufacturing Index was reported. ISM fell to 49... Read More
Art's Charts December 04, 2012 at 06:19 AM
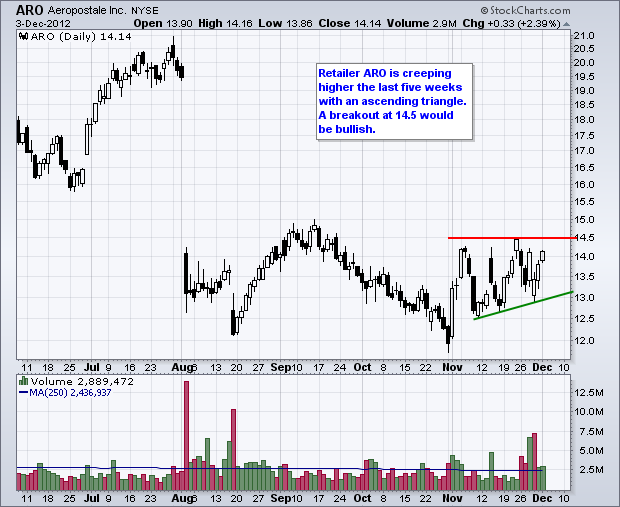
ARO Forms Ascending Triangle. DE Holds Gap within Short-Term Downtrend. Plus HON, MMM, MS, X This commentary and charts-of-interest are designed to stimulate thinking. This analysis is not a recommendation to buy, sell, hold or sell short any security (stock ETF or otherwise)... Read More
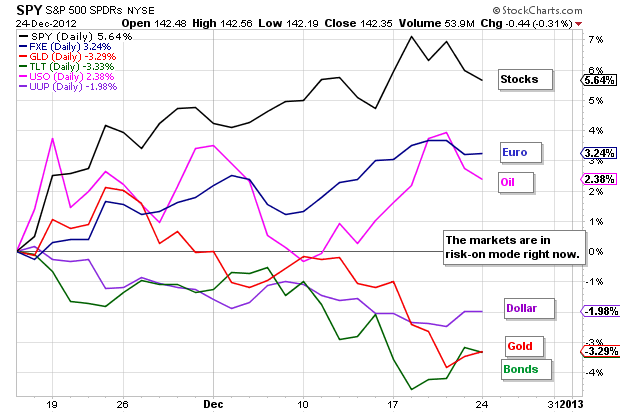
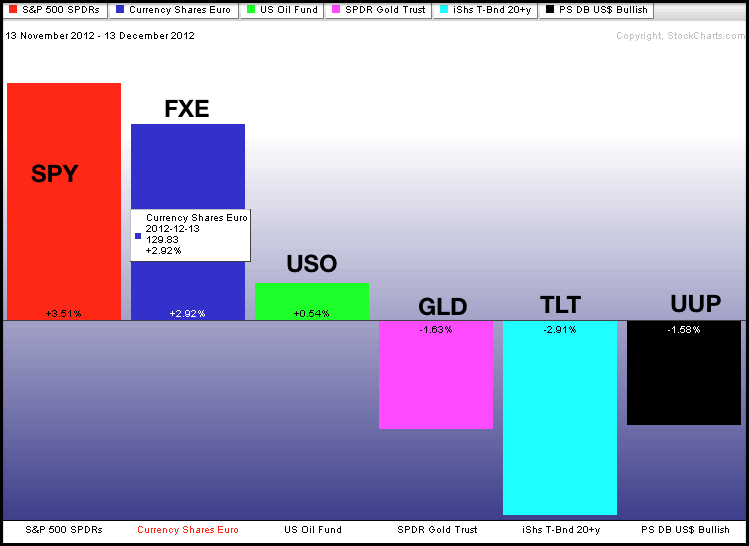
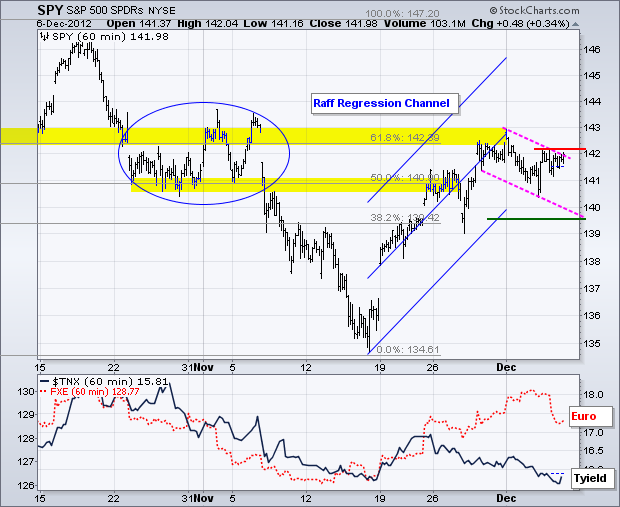
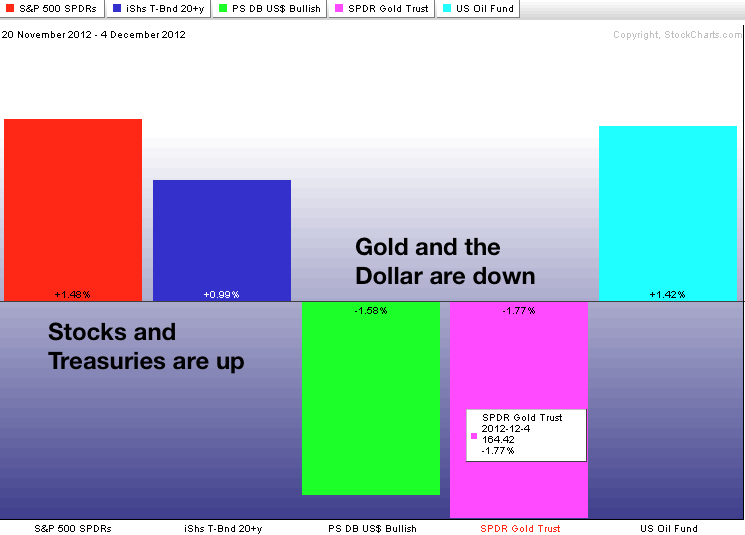
Art's Charts December 03, 2012 at 05:10 AM
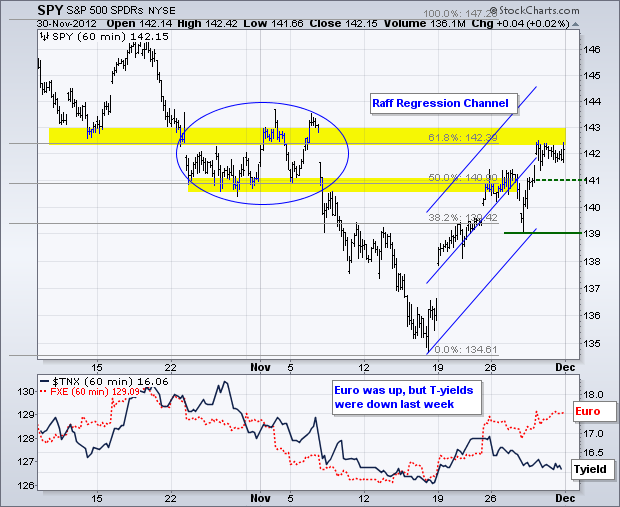
Despite all this talk on the fiscal cliff, it seems that the Euro is more important to the stock market right now. On the 60-minute chart, the indicator window shows the Euro Currency Trust (FXE) bottoming on 13-Nov and the S&P 500 ETF (SPY) bottoming on 16-Nov... Read More