Art's Charts May 31, 2013 at 05:44 AM
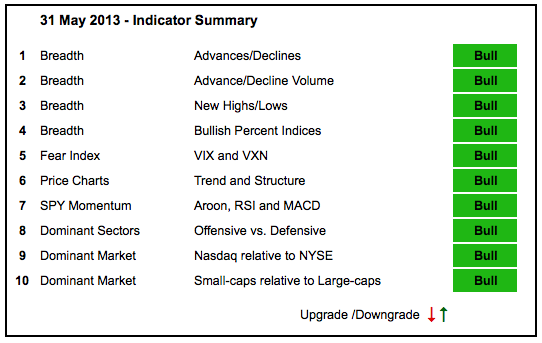
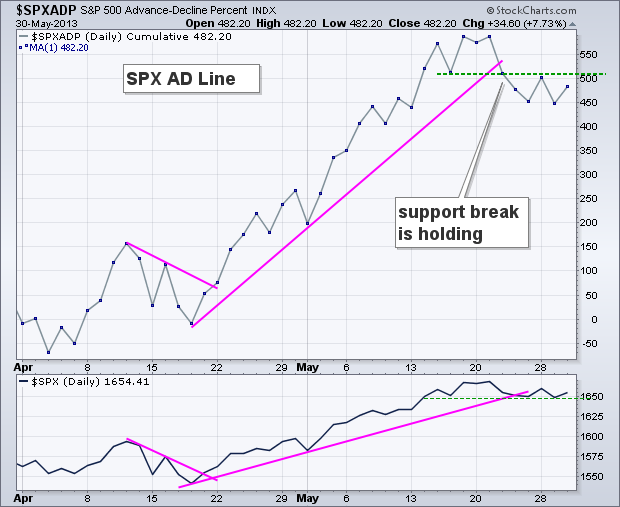
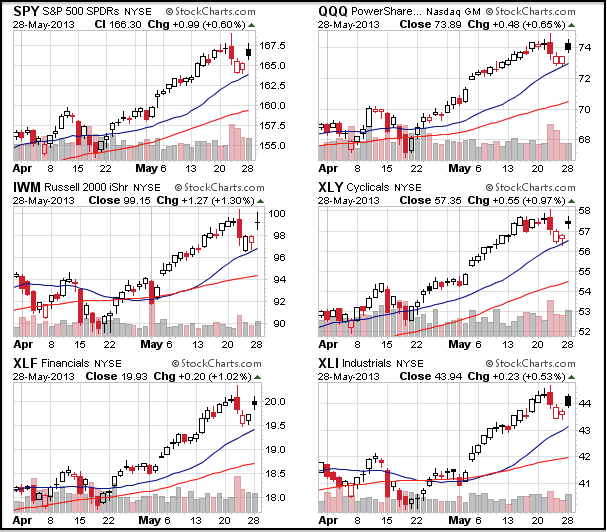
After hitting new highs in mid May, the major index ETFs moved into consolidation patterns the last two weeks. A little rest, or even a pullback, would be healthy for the uptrend. With this sideway movement, there is no change in the indicator summary... Read More
Art's Charts May 31, 2013 at 05:20 AM
Stocks moved higher again on Thursday with mid-caps leading the way. The overall gains were modest though and the major index ETFs remain below Tuesday's highs. The Finance SPDR (XLF) led the sectors here with a 1.2% gain on the day... Read More
Art's Charts May 30, 2013 at 05:31 AM
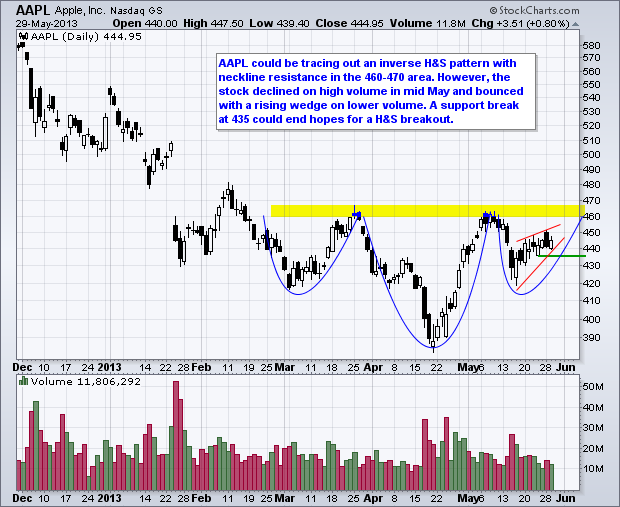
AAPL Stalls Just below Neckline Resistance. ABX Breaks Trend Line with Good volume. Plus HCA, JDSU and WNR This commentary and charts-of-interest are designed to stimulate thinking... Read More
Art's Charts May 30, 2013 at 04:50 AM
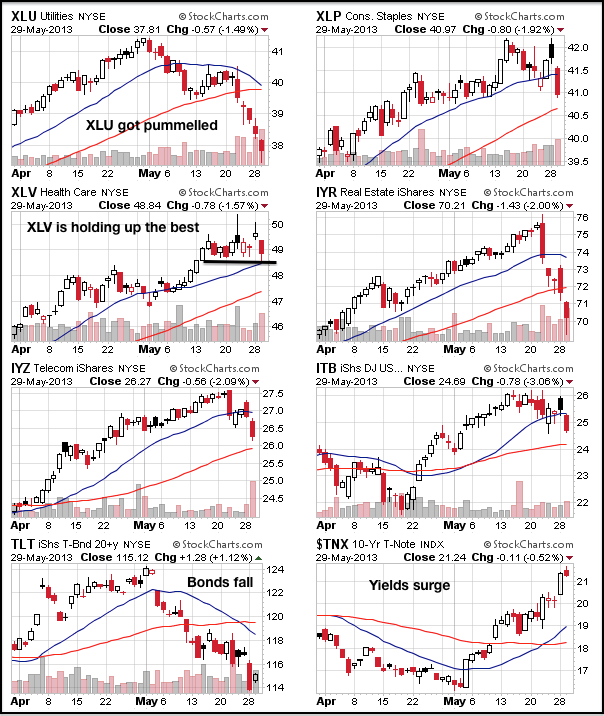
Stocks weakened on Wednesday with the defensive sectors leading the way down. The Consumer Staples SPDR (XLP), Healthcare SPDR (XLV) and Utilities SPDR (XLU) declined 1.5% or more... Read More
Art's Charts May 29, 2013 at 02:56 AM
Stocks got their pop with a strong surge on the open. Even though stocks closed higher, I was not impressed with post-gap price action. In addition, notice that indecisive candlesticks formed in a number of stocks and ETFs... Read More
Art's Charts May 28, 2013 at 05:13 AM
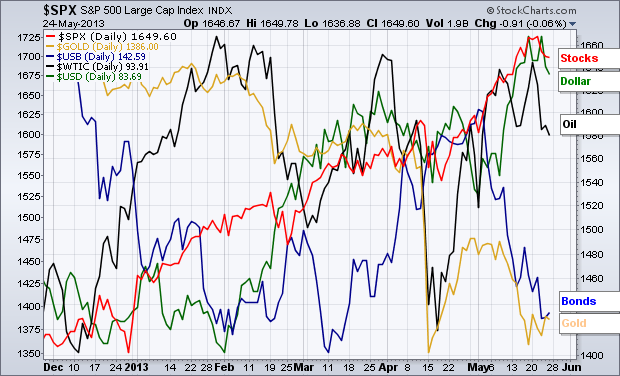
Stocks and the Dollar are in uptrends, while Treasuries and gold remain in downtrends. Stocks pulled back on Wednesday and opened weak on both Thursday and Friday. However, buyers stepped in after these weak openings and stocks closed off their lows on both days... Read More
Art's Charts May 28, 2013 at 05:09 AM
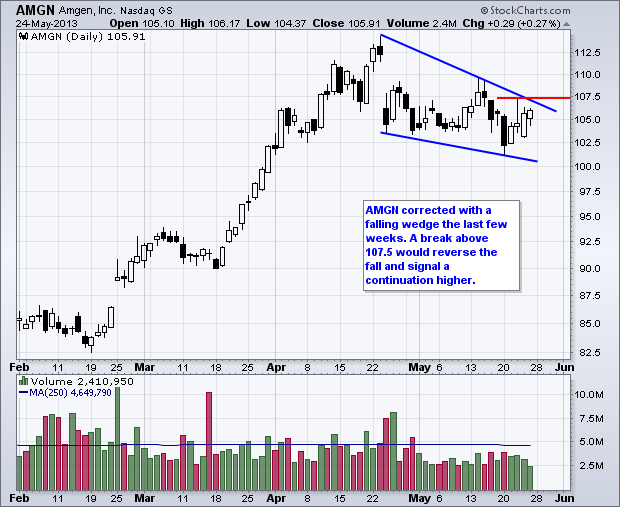
AMGN Corrects with Falling Wedge. FAST Surges and Consolidates. Plus BSBR, MOS IPI This commentary and charts-of-interest are designed to stimulate thinking. This analysis is not a recommendation to buy, sell, hold or sell short any security (stock ETF or otherwise)... Read More
Art's Charts May 24, 2013 at 05:09 AM
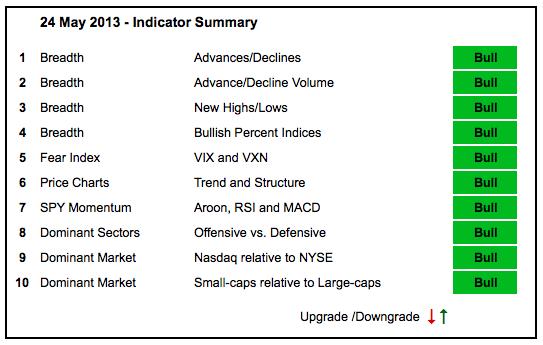
Stocks were hit with a reversal day on Wednesday, but this was not enough to affect the bigger uptrends. The AD Lines and AD Volume Lines hit new highs just before the reversal day. Net New Highs remain strong and the offensive sectors are leading again... Read More
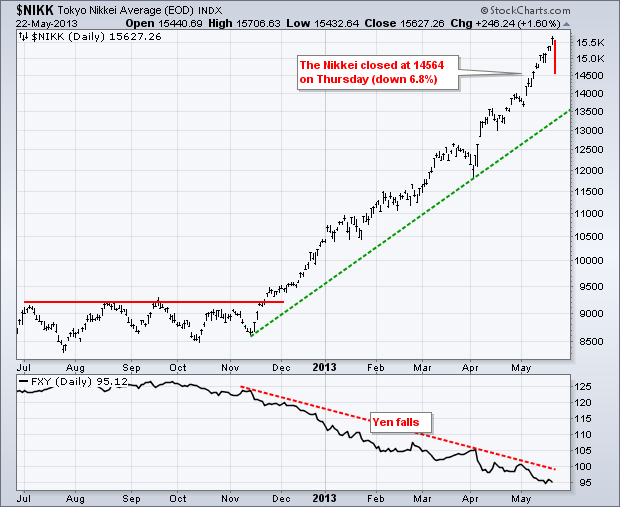
Art's Charts May 24, 2013 at 04:22 AM
Stocks plunged on Wednesday and firmed somewhat on Thursday. Even though the medium-term trends remain up, the short-term uptrends are in jeopardy and stocks are still ripe for a correction... Read More
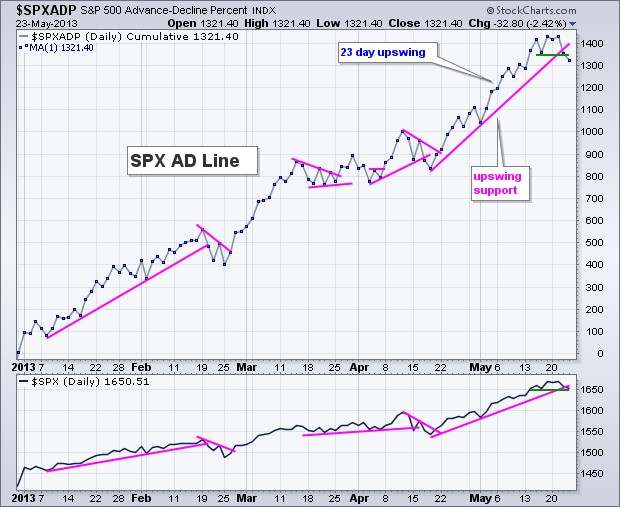
Art's Charts May 23, 2013 at 05:03 AM
Stocks finally got spooked as the bulls pulled in their horns and the bears showed their claws. The market opened strong and moved higher in early trading, but quickly reversed and moved sharply lower. The Fed got the blame as investors contemplated an end to quantitative easing... Read More
Art's Charts May 23, 2013 at 04:58 AM
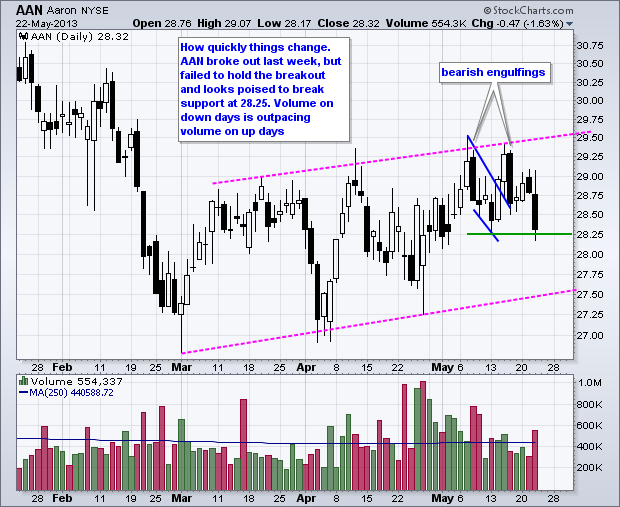
AAN Fails to hold Breakout. BBRY Underperforms the Market. Plus BTU, CHH, FCX, FDX, SYMC, XME This commentary and charts-of-interest are designed to stimulate thinking. This analysis is not a recommendation to buy, sell, hold or sell short any security (stock ETF or otherwise)... Read More
Art's Charts May 22, 2013 at 04:22 AM
The advance may be slowing, but stocks continue to grind higher. The major index ETFs finished with small gains as the Russell 2000 ETF (IWM) gained .02% and the S&P 500 ETF (SPY) advanced .14%... Read More
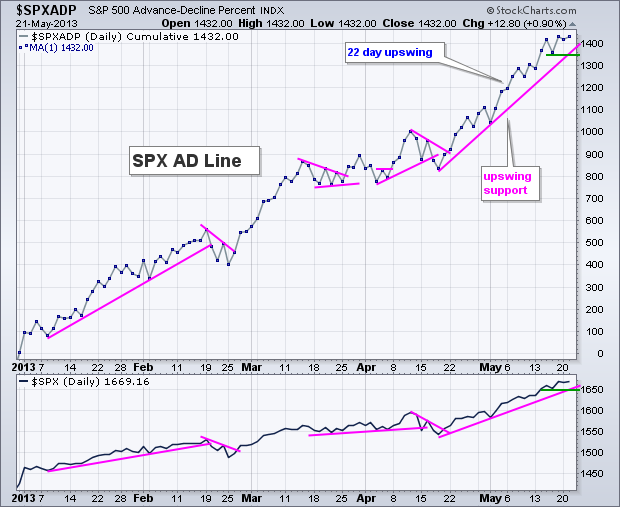
Art's Charts May 21, 2013 at 05:31 AM
Stocks edged higher in the morning and lower in the afternoon. As a result, the major index ETFs finished mixed on the day with the Russell 2000 ETF (IWM) closing slightly higher and the Dow Industrials SPDR (DIA) closing slightly lower... Read More
Art's Charts May 21, 2013 at 05:27 AM
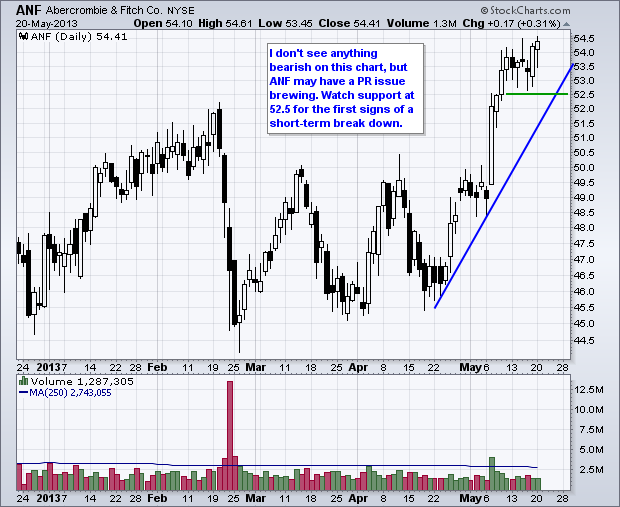
BSBR Gets Set for another Go at Resistance. FDX Breaks Pennant Resistance. Plus ANF, FNSR, STLD This commentary and charts-of-interest are designed to stimulate thinking. This analysis is not a recommendation to buy, sell, hold or sell short any security (stock ETF or otherwise)... Read More
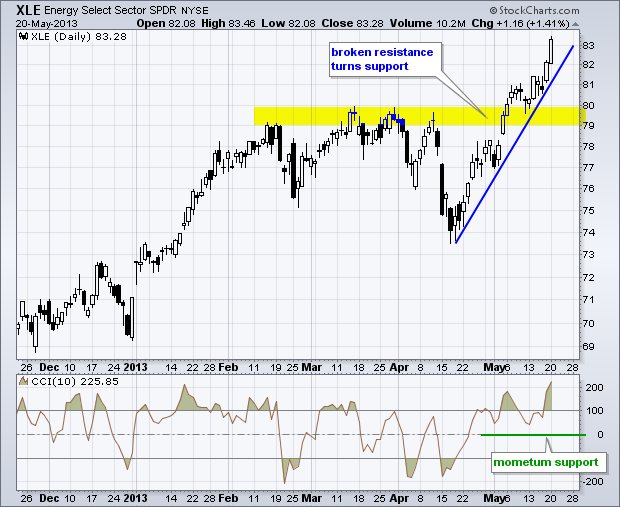
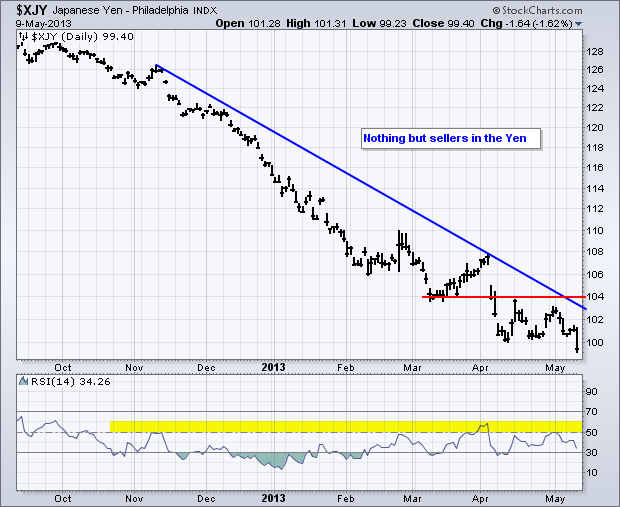
Art's Charts May 20, 2013 at 06:41 AM
There are simply no sellers out there. We can argue about low volume levels, the artificial Fed affect and lackluster economic data, but there are clearly more buyers than sellers in the stock market and stocks are rising... Read More
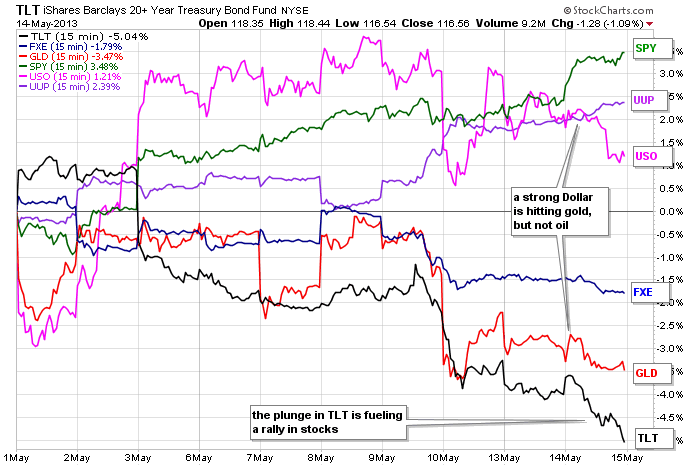
Art's Charts May 17, 2013 at 09:33 AM
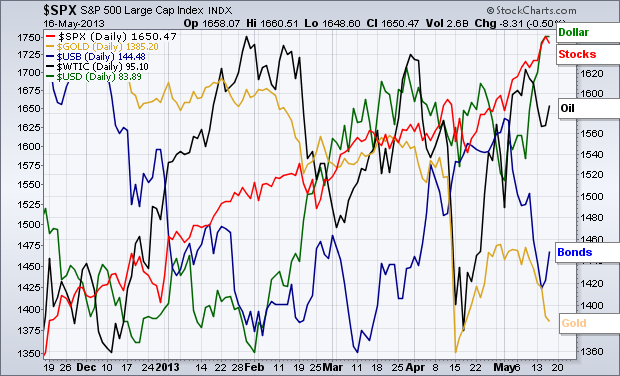
Stocks and the Dollar are performing well as both trade near six month highs. This strength is at the expense of Treasuries and gold, which are trading well below their November levels. The US Dollar Index ($USD) is trading at its highest levels since last summer... Read More
Art's Charts May 17, 2013 at 05:23 AM
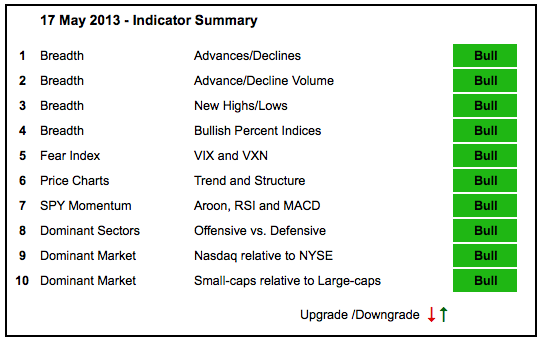
There is no change in the indicator summary as stocks extended their gains again this week. The AD Lines and AD Volume Lines hit new highs. Net New Highs remain firmly positive. Momentum is bullish, if not short-term overbought... Read More
Art's Charts May 17, 2013 at 04:59 AM
Stocks were trading flat most of the day, but got hit with selling pressure in the final hour. As a result, the major index ETFs closed modestly lower. The S&P MidCap 400 SPDR (MDY) and S&P 500 ETF (SPY) fell around .50% on the day... Read More
Art's Charts May 16, 2013 at 04:01 AM
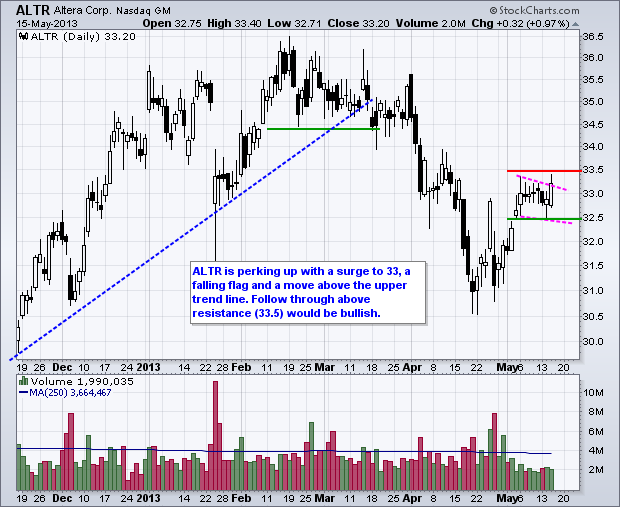
ALTR surges and forms small flag. ANN breaks wedge resistance with good volume. Plus BG, CIEN and EMC. This commentary and charts-of-interest are designed to stimulate thinking... Read More
Art's Charts May 16, 2013 at 03:12 AM
Stocks extended their uptrends with modest gains. All of the major index ETFs moved higher with the S&P MidCap 400 SPDR (MDY) and S&P 500 ETF (SPY) leading the way. Both were up just less than 1%. Eight of the nine sectors were up with only the Energy SPDR (XLE) moving lower... Read More
Art's Charts May 15, 2013 at 03:09 AM
Stocks surged and closed strong with small-caps leading the charge. All of the major index ETFs were up, but the Nasdaq 100 ETF (QQQ) and Nasdaq 100 Equal-Weight ETF (QQEW) lagged with relatively small gains (less than .50%). Apple was down sharply and weighed on QQQ... Read More
Art's Charts May 14, 2013 at 04:35 AM
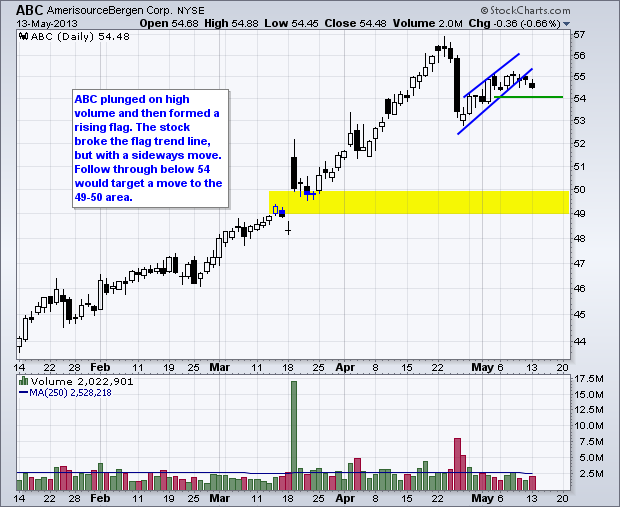
ABC Forms Bear Flag. FLIR Traces out Rising Wedge. Plus HPQ, PG, T This commentary and charts-of-interest are designed to stimulate thinking. This analysis is not a recommendation to buy, sell, hold or sell short any security (stock ETF or otherwise)... Read More
Art's Charts May 14, 2013 at 03:39 AM
Stocks meandered on Monday as the major index ETFs finished the day mixed. The Russell 2000 ETF (IWM) and S&P 500 Equal-Weight ETF (RSP) edged lower, while the S&P 500 ETF (SPY) and Nasdaq 100 ETF (QQQ) finished slightly higher... Read More
Art's Charts May 13, 2013 at 04:45 AM
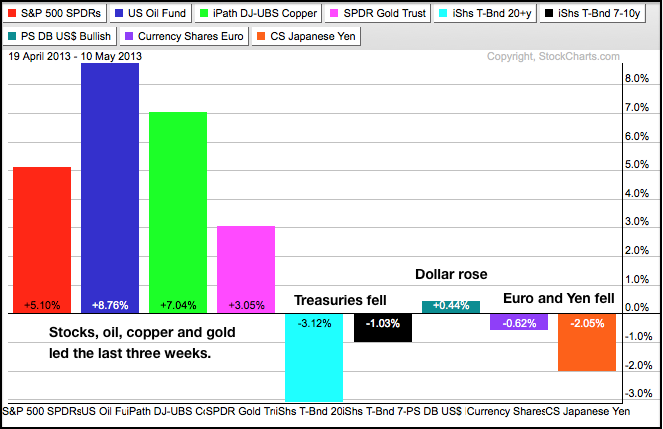
The intermarket picture is getting interesting with some big moves last week. First, stocks and oil have been moving higher since April 19th. The US Oil Fund (USO) is up almost 9%, while the S&P 500 ETF (SPY) is up just over 5%... Read More
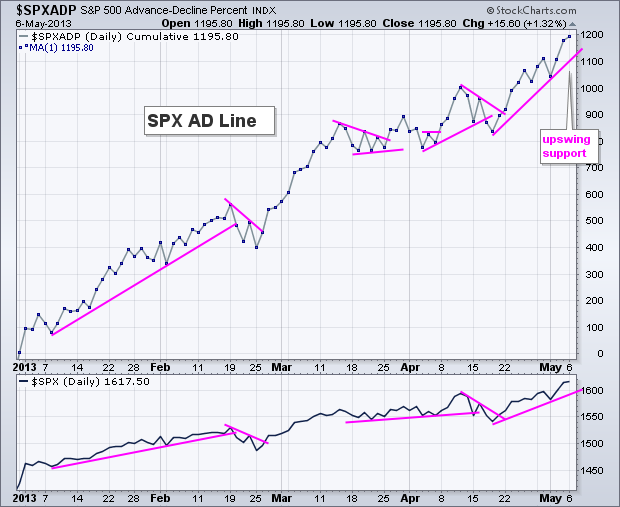
Art's Charts May 10, 2013 at 05:21 AM
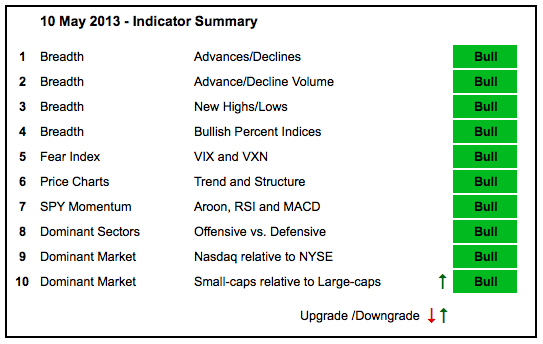
It does not get more bullish than this, which may be a sign that things are getting too bullish. The AD Lines, AD Volume Lines, major index ETFs and offensive sectors all hit 52-week highs this past week... Read More
Art's Charts May 10, 2013 at 04:14 AM
Stocks took a little breather on Thursday as the major index ETFs edged lower. The losses were fractional, but the markets were clearly shaken by something in the afternoon. Rumors were swirling that the Fed may hint at changes to its quantitative easing program... Read More
Art's Charts May 09, 2013 at 05:30 AM
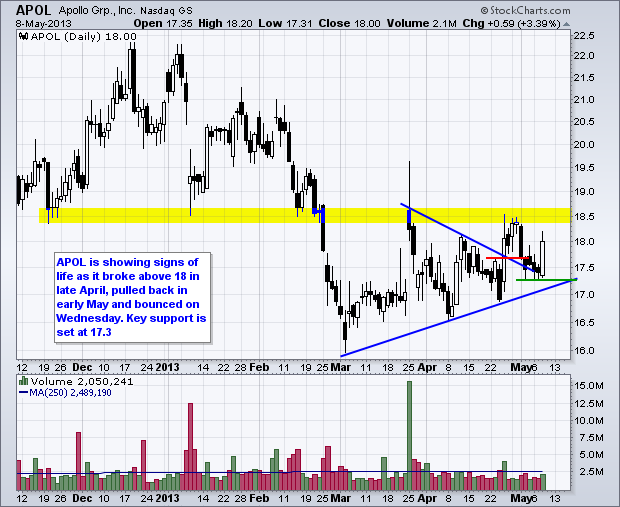
APOL Holds Support after Pullback. FNSR Fails to Hold Breakout and Forms Bearish Pattern. Plus DNDN, HSY, LAZ, WIN, WTW This commentary and charts-of-interest are designed to stimulate thinking... Read More
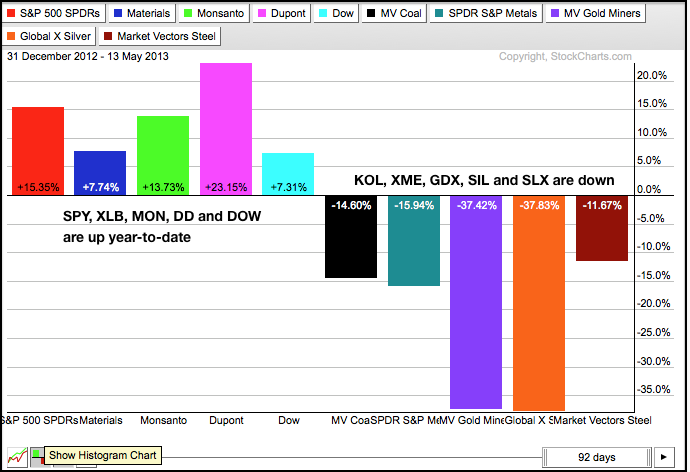
Art's Charts May 09, 2013 at 04:36 AM
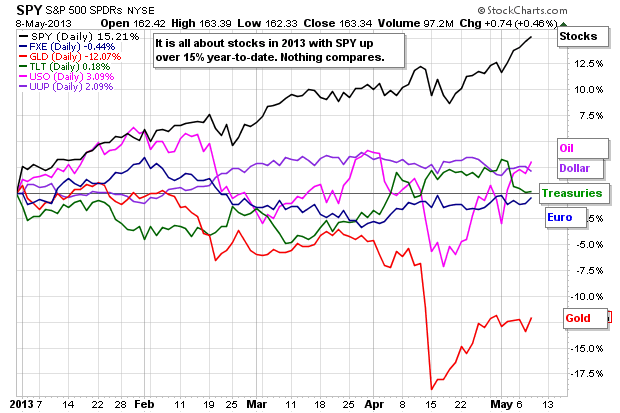
Stocks are the place to be, the only place to be. The performance chart below shows the S&P 500 ETF (SPY) up a whopping 15.21% year-to-date. 99.99% of fund managers would kill the other .01% for an annual return like this, not to mention a six month return... Read More
Art's Charts May 08, 2013 at 03:02 AM
Stocks extended their gains on Tuesday with small-caps and mid-caps leading the way. The Nasdaq 100 ETF (QQQ) ended down and showed some relative weakness though. Techs were weighed down by networking and semis. The Networking iShares (IGN) fell 1... Read More
Art's Charts May 07, 2013 at 07:07 AM
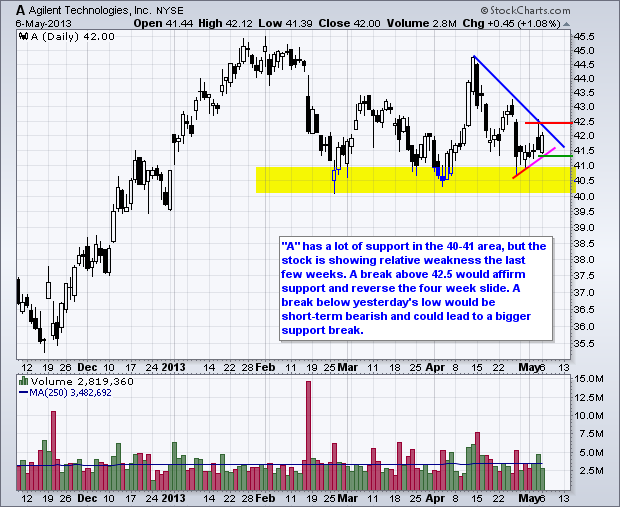
BOOM Firms in Key Retracement Zone. EA Gaps above Wedge Resistance. Plus A, GCI, GT, JNS, NTAP, PG This commentary and charts-of-interest are designed to stimulate thinking... Read More
Art's Charts May 07, 2013 at 06:40 AM
Stocks extended their gains with mid-caps, small-caps and micro-caps leading the way. The Russell Microcap Fund (IWC) was up almost 1% on the day. The sectors were mixed with the defensive sectors on the, well, defensive... Read More
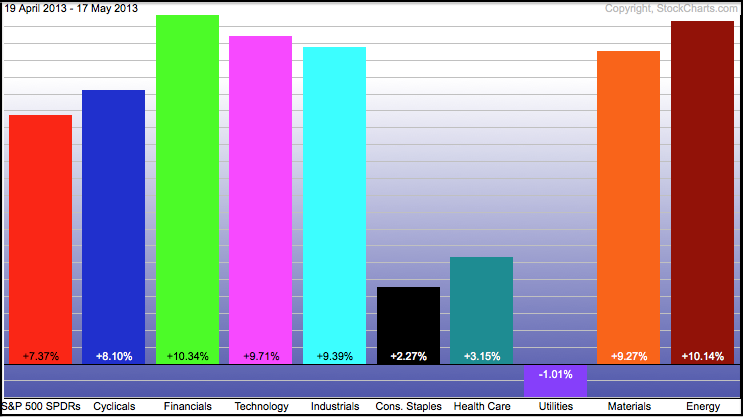
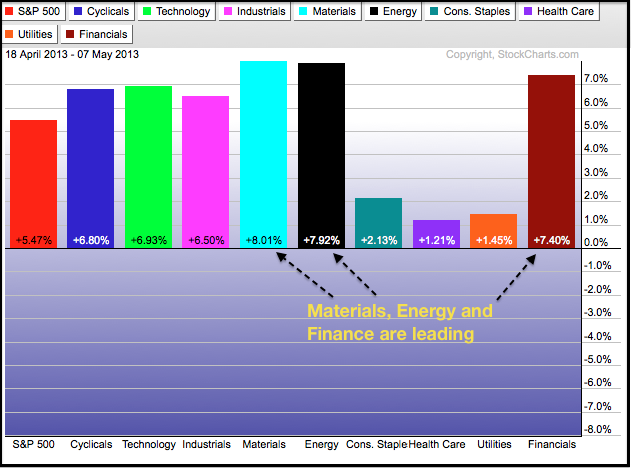
Art's Charts May 06, 2013 at 04:25 AM
It seems that market sentiment has done a 180 over the last few weeks. The defensive sectors went from leaders to laggards as the Consumer Discretionary SPDR (XLY) and Technology SPDR (XLK) led the market higher... Read More
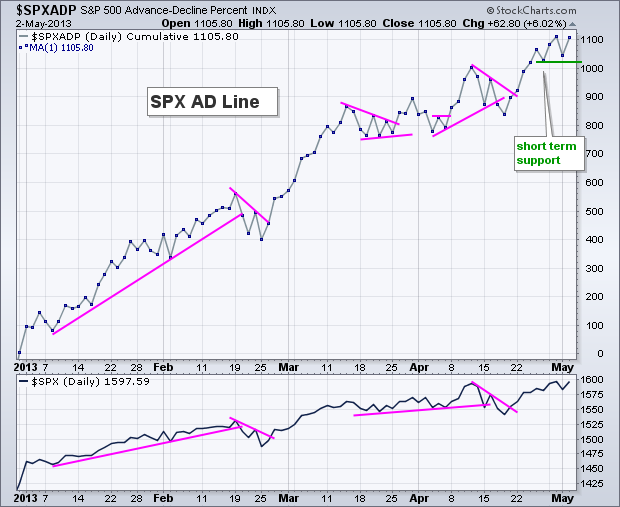
Art's Charts May 03, 2013 at 05:39 AM
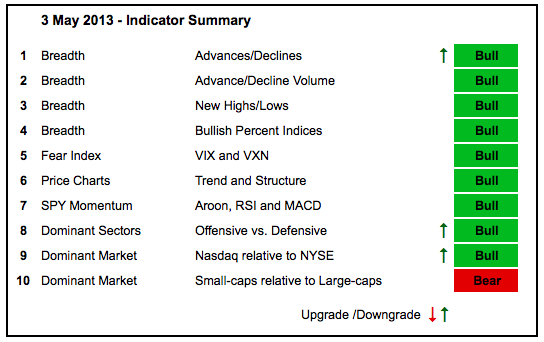
Stocks remain resilient both short-term and medium-term. SPY dipped in mid April, but surged in late April and hit a new high. The ETF also dipped on Wednesday, but surged to a new high on Thursday... Read More
Art's Charts May 03, 2013 at 04:51 AM
After getting spooked by the ADP Employment report on Wednesday, stocks greeted the five year low in Jobless Claims with a buying binge that pushed the S&P 500 ETF (SPY) above its April high. QQQ also erased Wednesday's low and hit a new high for 2013... Read More
Art's Charts May 02, 2013 at 05:23 AM
Stocks started the day weak, ignored the Fed and finished the day weak. Small-caps led the way lower with the Russell 2000 ETF (IWM) falling over 2%. The Nasdaq 100 ETF (QQQ) held up the best with the smallest decline... Read More
Art's Charts May 02, 2013 at 05:16 AM
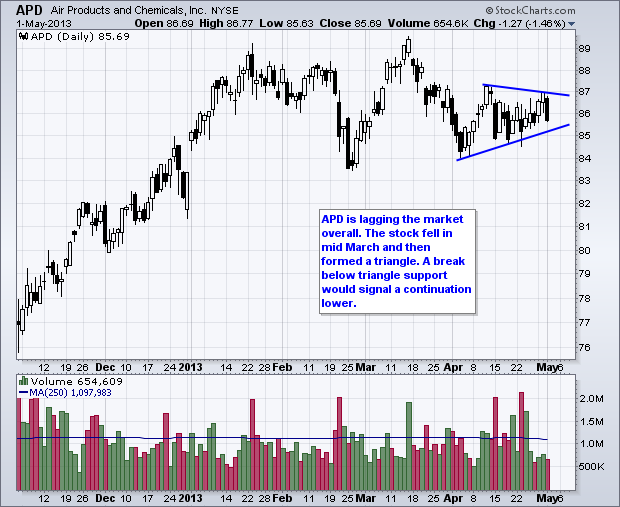
APD Shows Relative Weakness as Triangle Takes Shape. CSCO Fails to Follow Microsoft and Intel Higher. Plus CTAS, EL, MDP, STJ This commentary and charts-of-interest are designed to stimulate thinking... Read More
Art's Charts May 01, 2013 at 03:38 AM
Stocks extended their gains with the Nasdaq 100 ETF (QQQ) and S&P MidCap 400 SPDR (MDY) leading the way on Tuesday. Large techs, small-caps and mid-caps showed relative strength yesterday, but the overall gains were muted as we head into a FOMC announcement on Wednesday... Read More