Art's Charts June 27, 2013 at 05:35 AM
Programming note: I will be on vacation from June 28 to July 12 (Friday to Friday). This is the all important two-week family vacation. My contributions to Art's Charts and the Market Message will resume on Monday, July 15... Read More
Art's Charts June 27, 2013 at 05:31 AM
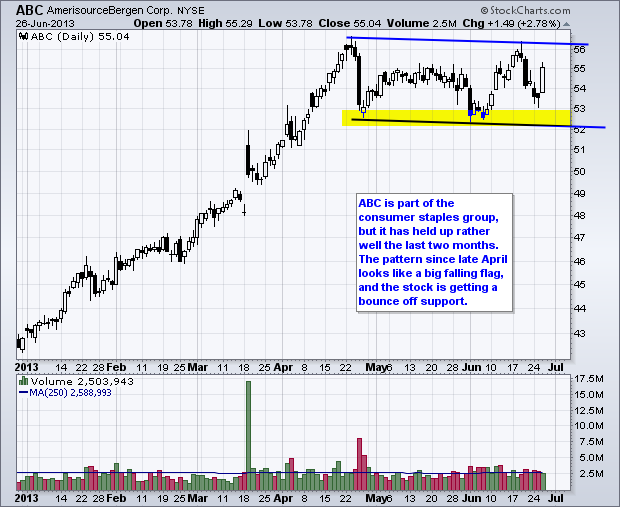
ABC Extends Long Consolidation. ALL Challenges Support Break. Plus DOX, MCK and NYT. This commentary and charts-of-interest are designed to stimulate thinking. This analysis is not a recommendation to buy, sell, hold or sell short any security (stock ETF or otherwise)... Read More
Art's Charts June 26, 2013 at 04:12 AM
Programming note: I will be on vacation from June 28 to July 12 (Friday to Friday). This is the all important two-week family vacation. My contributions to Art's Charts and the Market Message will resume on Monday, July 15... Read More
Art's Charts June 25, 2013 at 05:37 AM
Stocks moved lower again on Monday with broad-based selling pressure. The decline was, however, contained because the major index ETFs gapped down, bounced and then moved lower in the final hour... Read More
Art's Charts June 25, 2013 at 05:30 AM
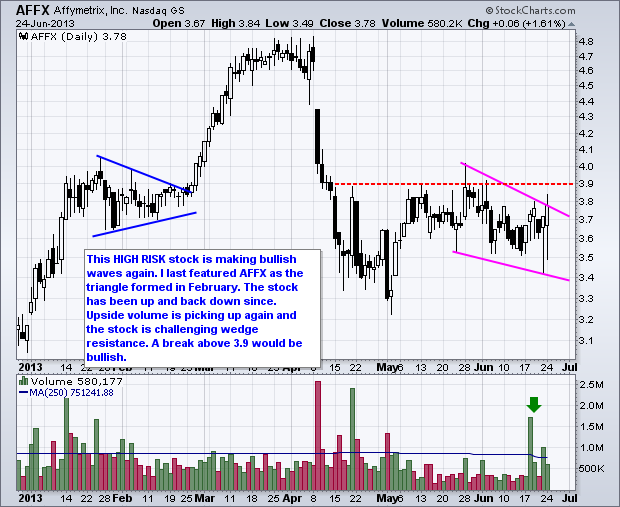
AFFX Returns to Support and Firms with Good Volume. ARUN Shows Relative Strength in June. Plus CHKP, FB, IPI This commentary and charts-of-interest are designed to stimulate thinking... Read More
Art's Charts June 24, 2013 at 04:18 AM
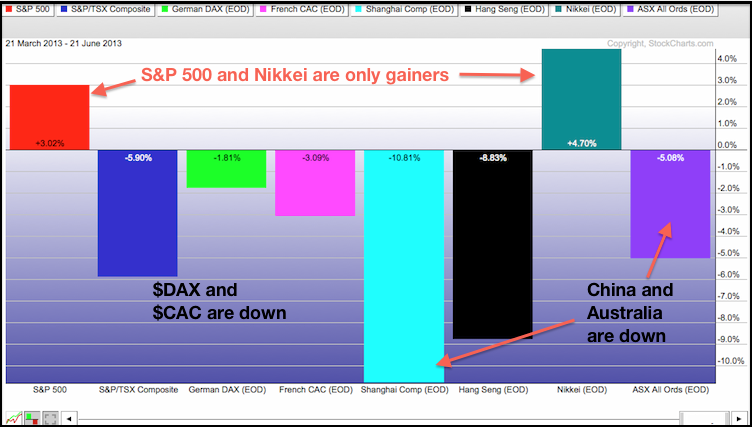
Chinese equities were hit hard on Monday with the Hang Seng Index ($HSI) falling over 2% and the Shanghai Composite ($SSEC) plunging over 5%. A surge in overnight repo rates (Chibor) is to blame. Note that the US experienced a similar rate surge just before the Lehman collapse... Read More
Art's Charts June 21, 2013 at 05:39 AM
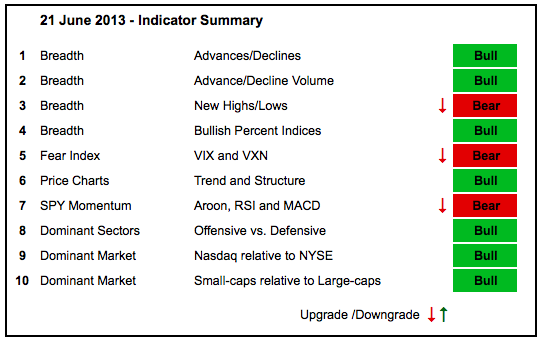
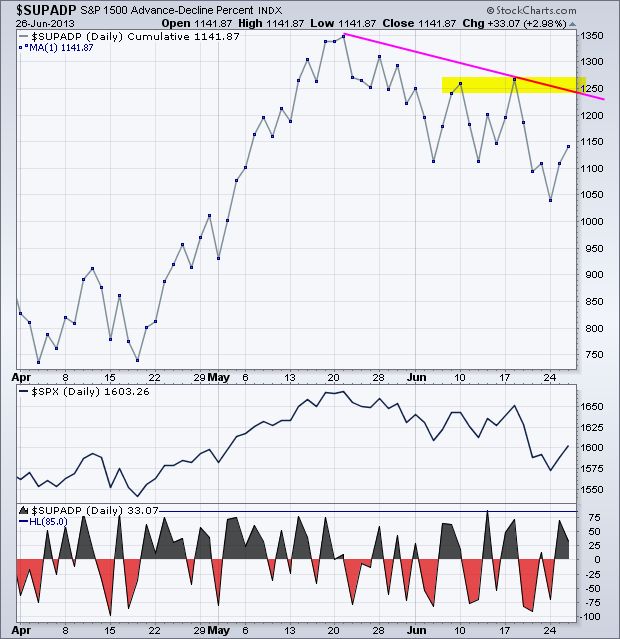
With weakness throughout June, three indicators were downgraded to bearish in the indicator summary. It is a rather strange trio though. Net New Highs are considered bearish because NYSE Net New Highs plunged to their lowest reading in over a year... Read More
Art's Charts June 21, 2013 at 04:57 AM
Stocks were hit hard with the major index ETFs falling over 2% on the day. Even though this decline looks massive on a short-term basis, it is relatively small on a six to twelve month timeframe... Read More
Art's Charts June 20, 2013 at 04:36 AM
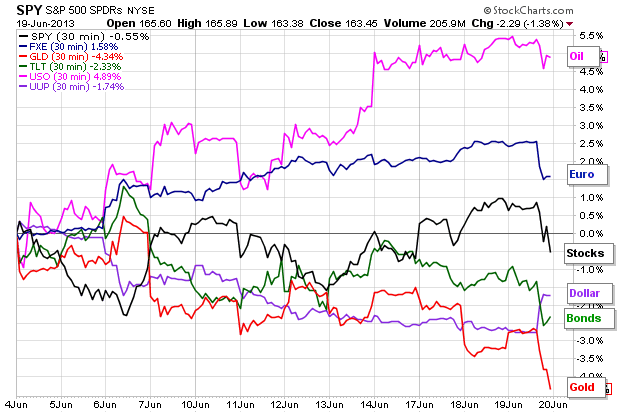
Stocks tried to front run the Fed and got burned when Bernanke stuck to his guns on tapering. The S&P 500 ETF (SPY) was up over 3% in the run up to the Fed meeting and fell 1.38% on Wednesday... Read More
Art's Charts June 20, 2013 at 04:28 AM
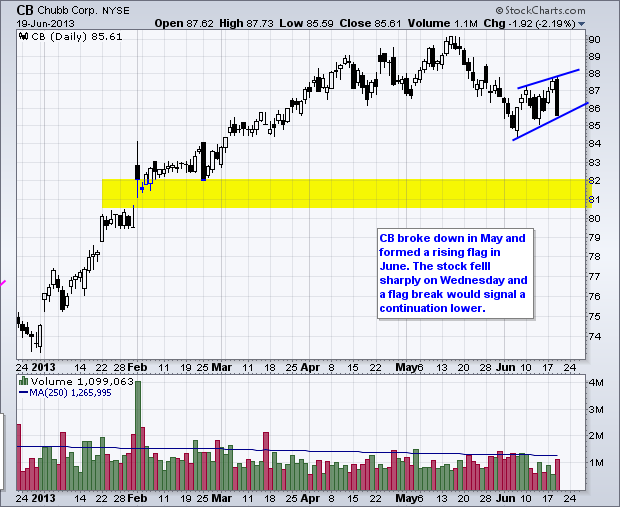
Bearish Continuation Patterns Takes Shape for CB. FCX Cannot Hold a Bid. Plus JBHT, MAR and VRSN. This commentary and charts-of-interest are designed to stimulate thinking... Read More
Art's Charts June 19, 2013 at 03:33 AM
Stocks extended their upswing as the major index ETFs broke channel resistance. Small-caps led this week's advanced as the IWM:SPY ratio moved to its highest level of the month. Relative strength in small caps suggests a good appetite for risk at the moment... Read More
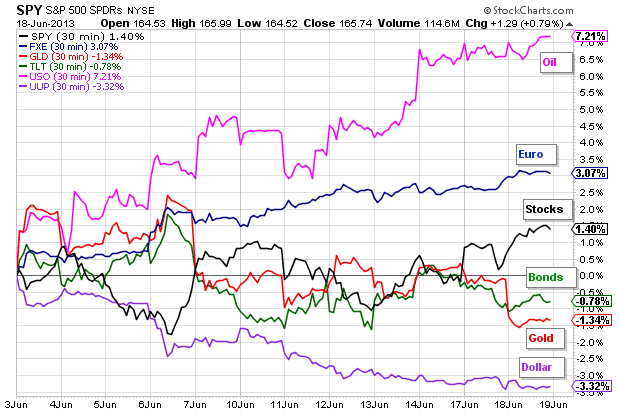
Art's Charts June 18, 2013 at 05:01 AM
Stocks surged on the open on Monday, fell back in the afternoon and then popped near the close. Intraday price action was not that impressive because there was really no follow through to the morning surge... Read More
Art's Charts June 18, 2013 at 04:55 AM
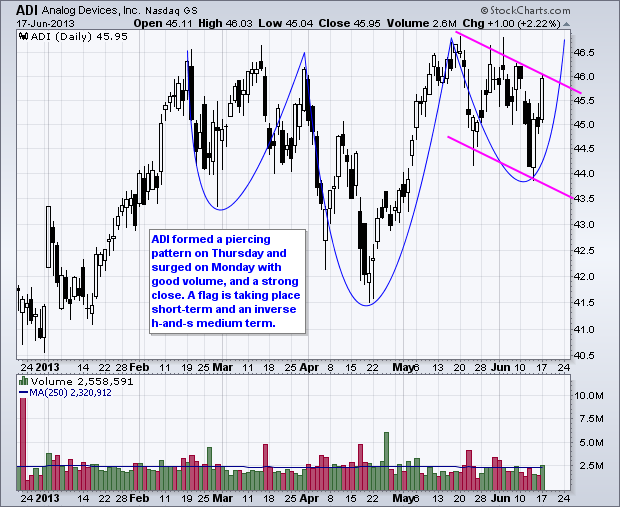
ADI Surges with Two Bullish Patterns at Work. ETFC Forms Bullish Consolidation after Big Surge. Plus FDX, HON, NBR, PG, TSO This commentary and charts-of-interest are designed to stimulate thinking... Read More
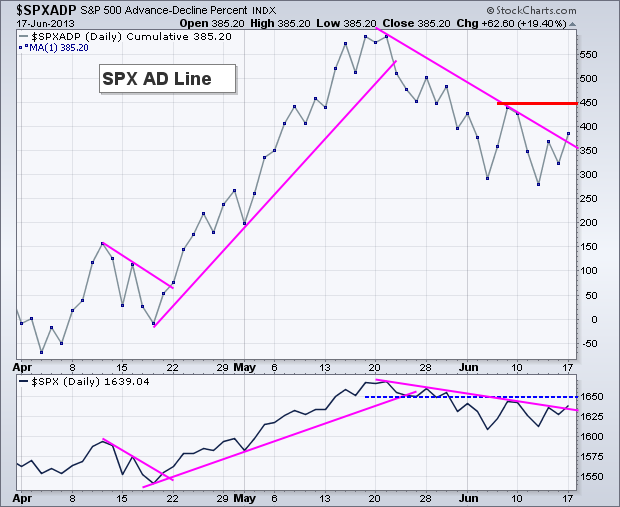
Art's Charts June 17, 2013 at 04:37 AM
Trading has sure been choppy the last four weeks, and it could get even choppier as the Fed meets this week. Ugh. The talk of Fed tapering began 4-5 weeks ago and this triggered an adjustment in the markets... Read More
Art's Charts June 14, 2013 at 05:34 AM
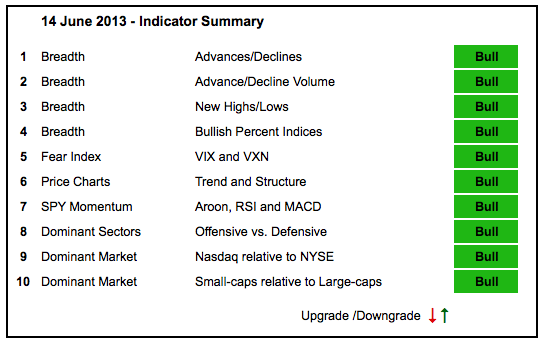
There is still no change in the indicator summary. Stocks corrected last four weeks and this correction weighed on the NYSE the most. The NYSE AD Line fell, but remains in an uptrend overall. NYSE Net New Highs turned negative for the first time since November... Read More
Art's Charts June 14, 2013 at 04:22 AM
Stocks caught a bid on Thursday as the major index ETFs advanced over 1% on the day. A better-than-expected retail sales report put stocks on a positive footing from the start and they extended their advance throughout the day... Read More
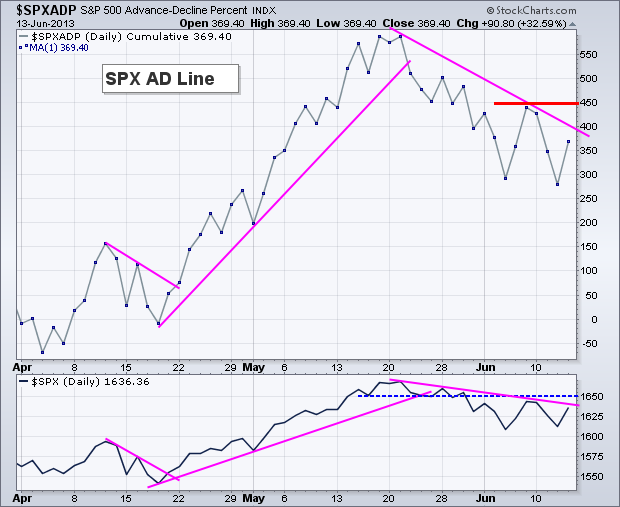
Art's Charts June 13, 2013 at 05:25 AM
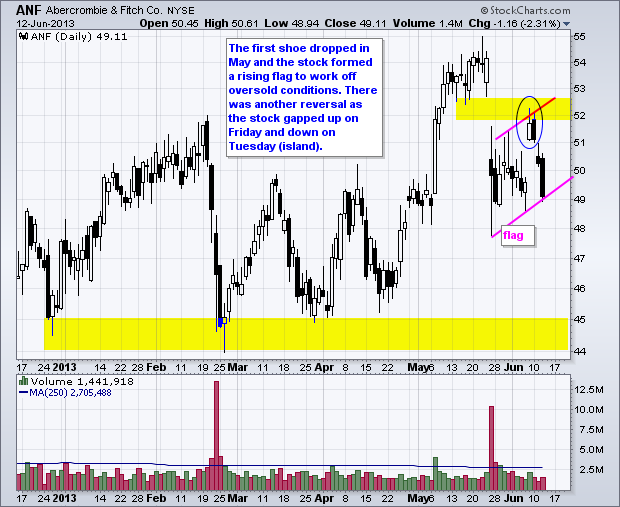
ANF Forms Island Reversal. BHI Gaps Down and Tests Support. Plus FL, IBM, MMM, NEM, URBN This commentary and charts-of-interest are designed to stimulate thinking. This analysis is not a recommendation to buy, sell, hold or sell short any security (stock ETF or otherwise)... Read More
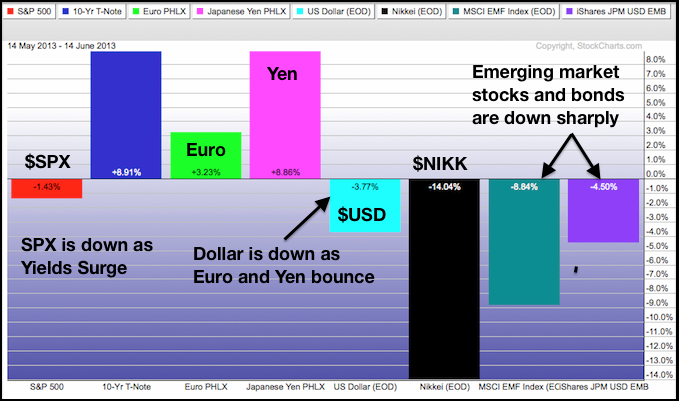
Art's Charts June 13, 2013 at 04:39 AM
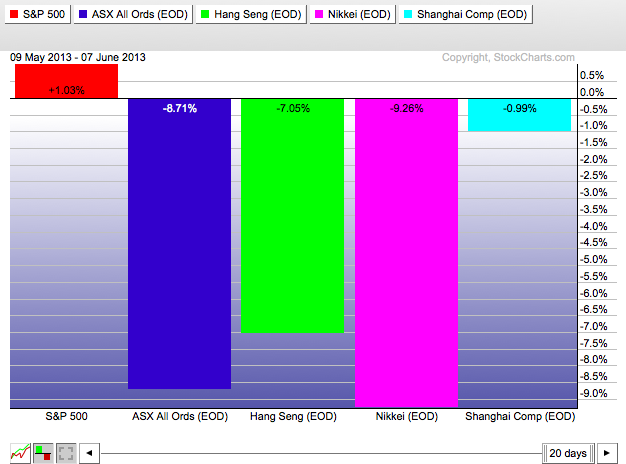
The Asian rout continues as the Shanghai Composite ($SSEC) caught up with a 2.83% decline on Thursday. The Hang Seng Index ($HSI) fell another 2.3% and the Nikkei 225 ($NIKK) plunged over 6%... Read More
Art's Charts June 12, 2013 at 04:13 AM
Stocks opened weak, got a pretty nice bounce and then turned lower to close weak. The major index ETFs were down around 1%. All sectors were down with the Energy SPDR (XLE) and Basic Materials SPDR (XLB) leading the way... Read More
Art's Charts June 11, 2013 at 05:49 AM
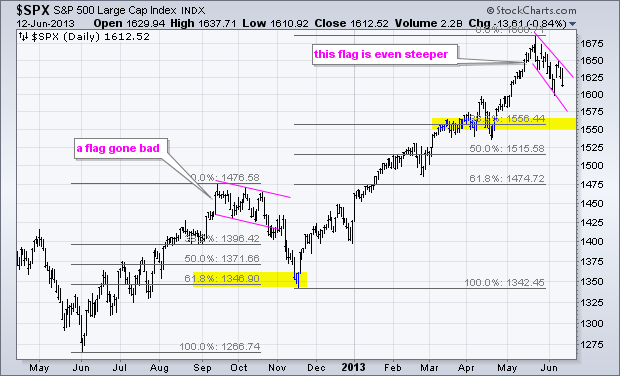
US stocks are actually looking vulnerable on the charts as the major index ETFs stall near resistance levels and key retracements. Also note that Asian stocks were weak on Tuesday with the Shanghai Composite ($SSEC), Hang Seng Index ($HSI) and Nikkei 225 ($NIKK) falling over 1%... Read More
Art's Charts June 11, 2013 at 05:15 AM
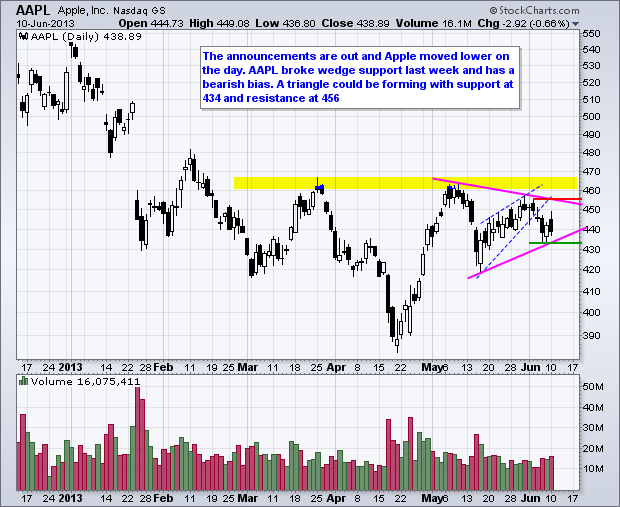
AAPL Battles Resistance after Announcements. AEO Forms Bear Flag. Plus COST, FCX, MHK, VLO This commentary and charts-of-interest are designed to stimulate thinking. This analysis is not a recommendation to buy, sell, hold or sell short any security (stock ETF or otherwise)... Read More
Art's Charts June 10, 2013 at 04:53 AM
Stocks reacted positively to a rather routine employment report. The Labor department reported a 175,000 increase in non-farm payrolls for May. This is the not-to-hot and not-to-cold version of the jobs report... Read More
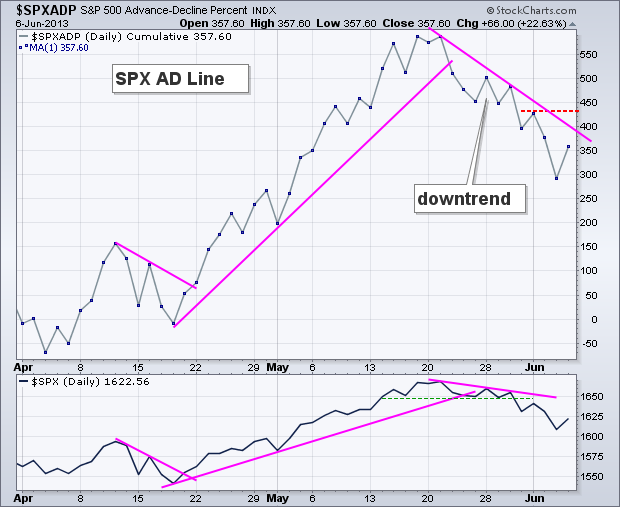
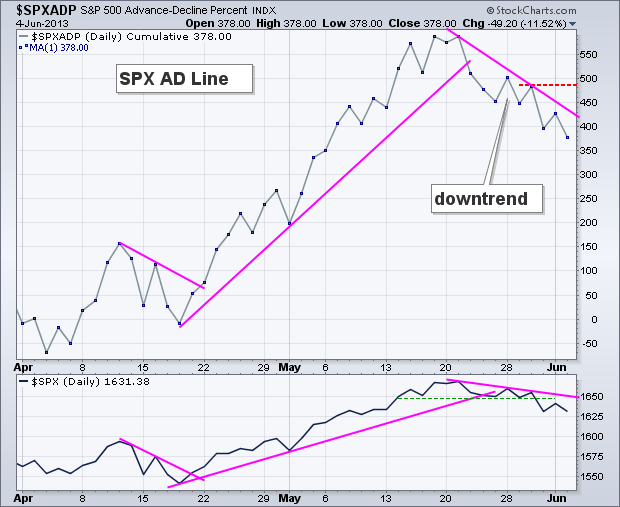
Art's Charts June 07, 2013 at 05:18 AM
The market is hitting its first make-or-break point. The bulk of the evidence remains bullish and this decline is still considered a correction within a bigger uptrend. The current decline, however, has extended long enough to push some indicators to the brink though... Read More
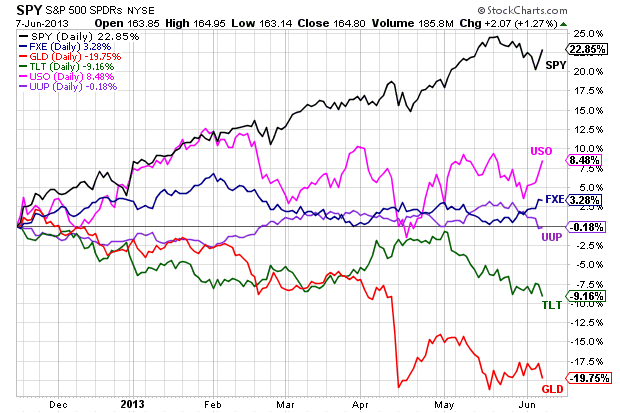
Art's Charts June 07, 2013 at 04:00 AM
And now for the employment report. Here's the thing with these big reports. Traders have to get two things right to successfully trade the report. First, you have to guess the non-farm payroll number. Second, you have to guess the market's reaction... Read More
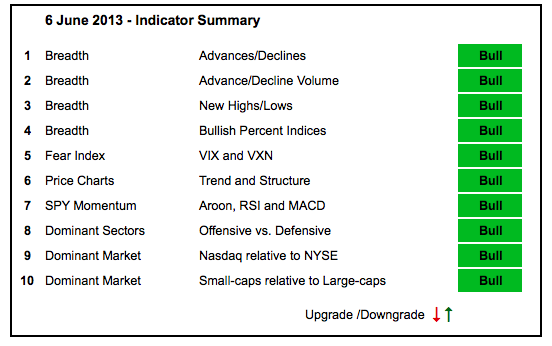
Art's Charts June 06, 2013 at 05:06 AM
It was a sea of red on Wednesday as the major index ETFs extended their declines and all nine sectors fell. That's the bad news. The good news, perhaps, is that the stock market is short-term oversold now. The upcoming employment numbers represent the uncertain news... Read More
Art's Charts June 06, 2013 at 05:01 AM
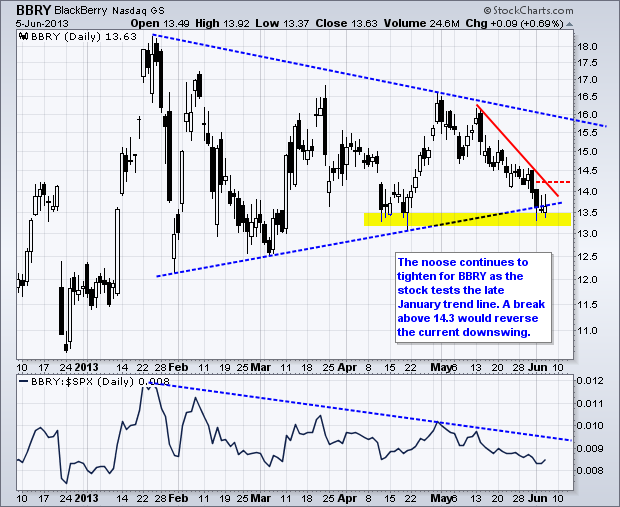
BBRY Tests Channel Support with Bounce. DE Breaks Flag Support. Plus IMAX, KBH, MWV, PKI This commentary and charts-of-interest are designed to stimulate thinking. This analysis is not a recommendation to buy, sell, hold or sell short any security (stock ETF or otherwise)... Read More
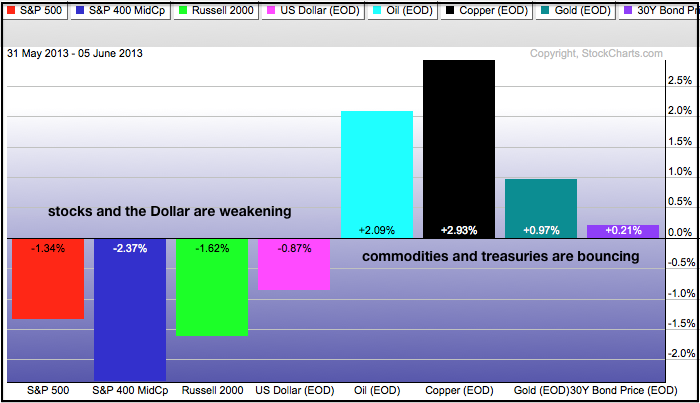
Art's Charts June 05, 2013 at 05:26 AM
Stocks were all over the place on Tuesday. The major index ETFs opened stronger, moved lower during the day and bounced in the afternoon. Despite this bounce, the major index ETFs closed lower with the Russell 2000 ETF (IWM) leading the way (-1.06%)... Read More
Art's Charts June 04, 2013 at 05:41 AM
Stocks opened weak, but firmed and rebounded in the afternoon. The major index ETFs finished mixed on the day with the S&P MidCap 400 SPDR (MDY) falling .34% and the Russell 2000 ETF (IWM) rising .95% on the day. Wow, you don't see that very often... Read More
Art's Charts June 04, 2013 at 05:37 AM
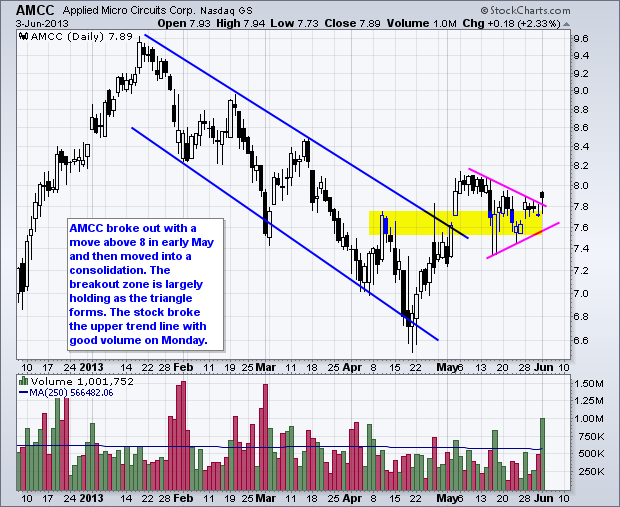
AMCC Makes a Move with Good Volume. ASEI Tests Support with Long Lower Shadow. Plus CAT, ISRG, JBLU, NIHD This commentary and charts-of-interest are designed to stimulate thinking... Read More
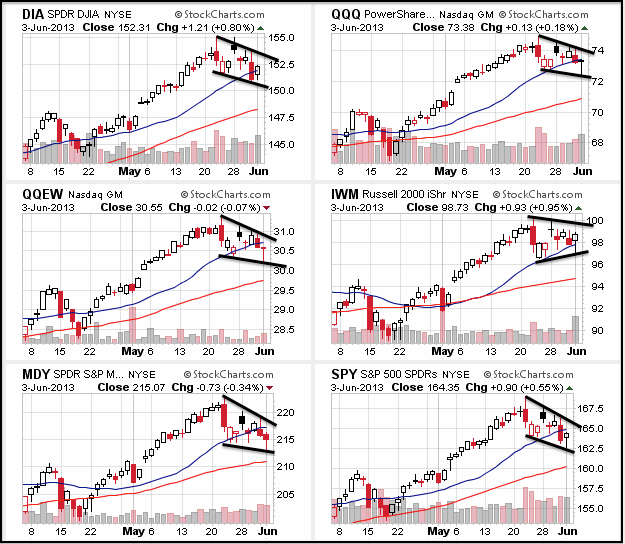
Art's Charts June 03, 2013 at 06:04 AM
The major index ETFs closed lower as stocks were hit with some pretty strong selling pressure Friday afternoon. The S&P 500 ETF (SPY) led the way with a 1.44% decline... Read More