Art's Charts December 23, 2013 at 05:24 AM
Programming Note: I will be taking time off between Christmas Eve and New Years. The next commentary for Art's Charts will be on Thursday, January 2nd... Read More
Art's Charts December 20, 2013 at 04:50 AM
After correcting the first two weeks of December, stocks caught a big bid after the FOMC policy statement and the major index ETFs recouped their prior losses. SPY fell from 182 to 178 and then surged to 182 on Wednesday... Read More
Art's Charts December 20, 2013 at 04:15 AM
After big gains on Wednesday, stocks corrected a bit to digest these gains on Thursday. The Russell 2000 ETF (IWM) and the S&P MidCap 400 ETF (MDY) fell back with losses around .75% on the day. DIA edged higher with a fractional gain, while SPY edged lower... Read More
Art's Charts December 19, 2013 at 05:46 AM
The Fed finally decided to taper and the markets are reacted in a big way. Note that the Fed merely reduced its quantitative easing from $85 billion per month to $75 billion. It is, however, a start that marks a change in Fed policy... Read More
Art's Charts December 19, 2013 at 05:31 AM
BAX Surges to Wedge Trend Line on Good Volume. DHI Affirms Support with Big Bounce. Plus MXIM, NVDA, TIBX, XLNX Individual charts are below video. Sorry but your browser doesn't support HTML5 video... Read More
Art's Charts December 18, 2013 at 04:14 AM
Today looks like a big day. First, we get housing starts and building permits before the open. Second, we get the Fed policy statement at 2PM ET. This is also Chairman Bernanke's last Fed meeting and last press conference, which will be at 2:30PM... Read More
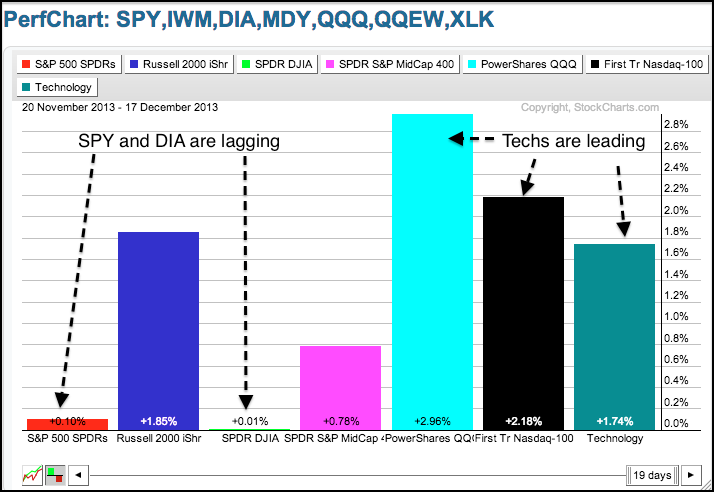
Art's Charts December 17, 2013 at 06:41 AM
Stocks got a bounce on Monday with the Russell 2000 ETF (IWM) leading the way. The entire bounce, however, occurred in the first twenty minutes of trading... Read More
Art's Charts December 17, 2013 at 06:35 AM
CRM Stalls at Support Zone. CVC Forms Continuation Pattern after Breakout. Plus CY, IBM, KSS and NNA Individual charts are below video. Sorry but your browser doesn't support HTML5 video... Read More
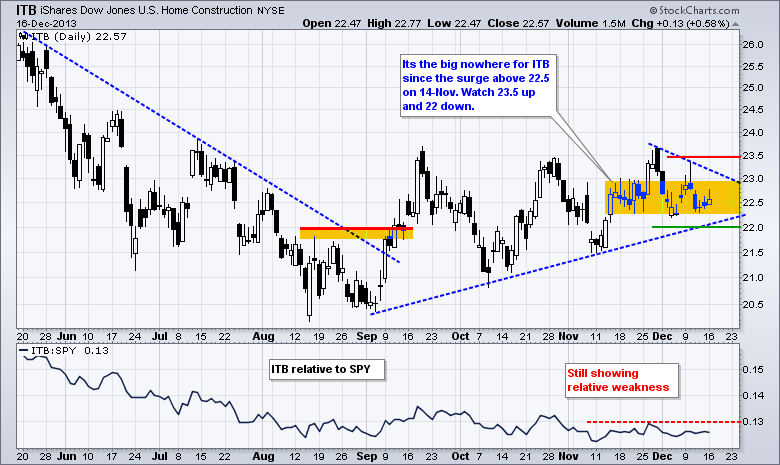
Art's Charts December 16, 2013 at 04:48 AM
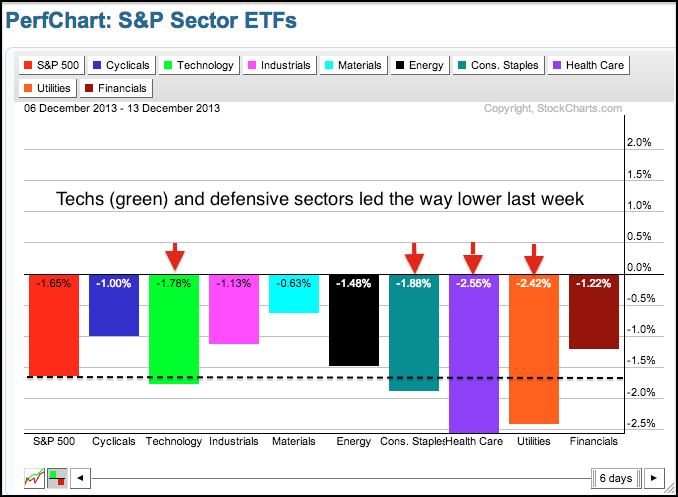
Stocks extended their correction as the S&P 500 ETF (SPY) saw its biggest weekly decline since August. The Russell 2000 ETF (IWM) led the major index ETFs lower with a 2% decline last week. In an interesting twist, the defensive sectors showed the biggest losses... Read More
Art's Charts December 13, 2013 at 04:41 AM
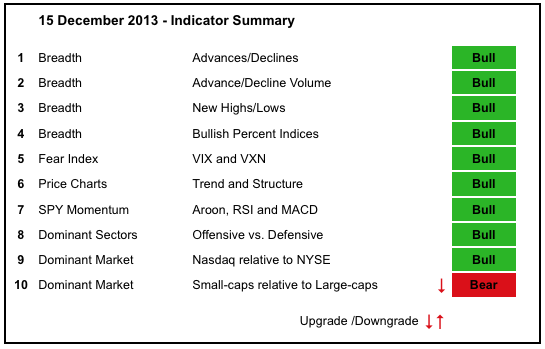
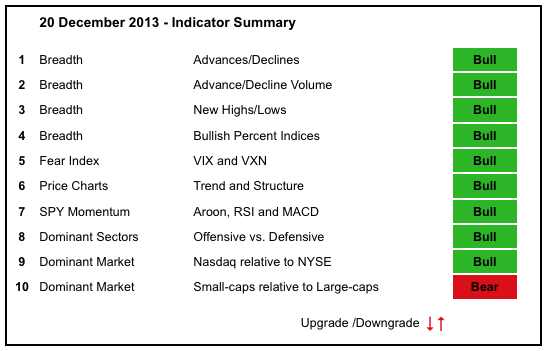
The December pullback weakened a few indicators, but the bulk of the long-term evidence remains bullish. Most notably, the NYSE AD Line formed a small bearish divergence, as did the NYSE AD Volume Line... Read More
Art's Charts December 13, 2013 at 03:37 AM
Stocks put in a mixed performance on Thursday as the Russell 2000 ETF (IWM) edged higher and the Nasdaq 100 ETF (QQQ) edged lower. The sectors were also mixed with the Consumer Staples SPDR (XLP) taking the biggest hit (-1.38%)... Read More
Art's Charts December 12, 2013 at 07:19 AM
Stocks extended their corrective ways as the major index ETFs fell over 1%. While most news outlets suggested that this was a taper tantrum, I am not so sure because stocks were up substantially in November, not to mention year-to-date... Read More
Art's Charts December 12, 2013 at 07:10 AM
DDD Forms Dark Cloud at Prior High. DNDN Edges Higher with Good Volume. Plus EBAY, SYSS, TSM and XONE Individual charts are below video. Sorry but your browser doesn't support HTML5 video... Read More
Art's Charts December 11, 2013 at 05:06 AM
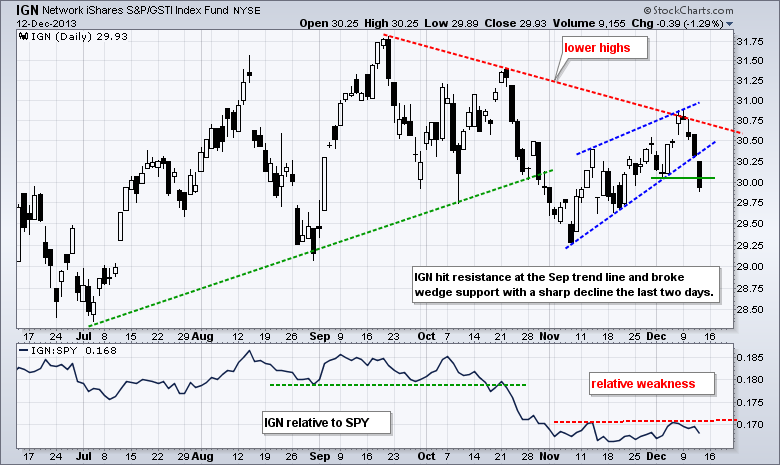
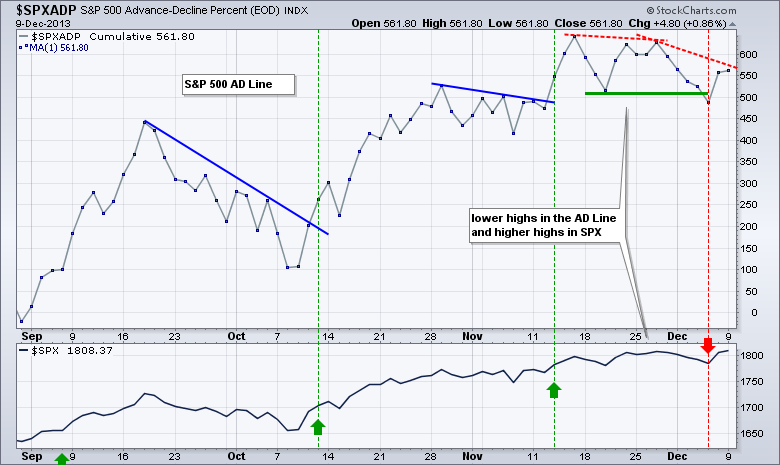
SPY and QQQ remain in short-term uptrends, but stocks are in a December funk of sorts. Small-caps are lagging as IWM filled its gap and failed to hold its breakout. As shown yesterday, the S&P 500 AD Line formed a bearish divergence and broke support... Read More
Art's Charts December 10, 2013 at 06:02 AM

BOOM Shows Relative Weakness. CVC Breaks Out with Good Volume. Plus FLIR, LXK, SWC Individual charts are below video. Sorry but your browser doesn't support HTML5 video... Read More
Art's Charts December 10, 2013 at 04:25 AM
Stocks meandered on Monday with the Nasdaq 100 ETF (QQQ) edging higher (.41%) and the Russell 2000 ETF (IWM) closing fractionally lower (-.03%). Seven sectors were up and two were down (XLU and XLY)... Read More
Art's Charts December 06, 2013 at 04:48 AM
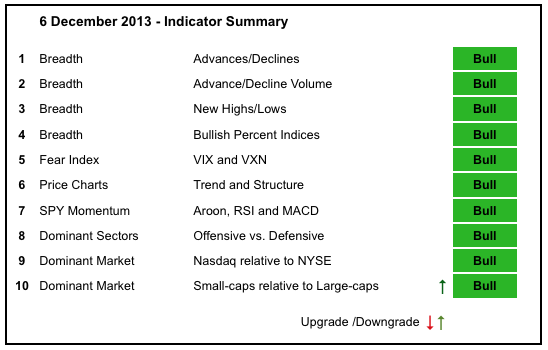
The bulk of the evidence remains bullish as stocks continue in strong uptrends. The Nasdaq AD Line and AD Volume Line hit new highs as techs led the market in November... Read More
Art's Charts December 06, 2013 at 03:48 AM
Stocks extended their corrective ways as the S&P 500 ETF (SPY) lost ground for the fifth consecutive day. Bespoke reports that 1996 was the last time the S&P 500 started December with a five day decline. Maybe so, but the index is down a mere 1... Read More
Art's Charts December 05, 2013 at 04:35 AM
Stocks extended their mixed correction with weakness for the third day running. The declines, however, remain very modest and selling pressure has been contained. The Russell 2000 ETF (IWM) lost .27% on the day, while the Nasdaq 100 ETF (QQQ) edged higher with a .09% gain... Read More
Art's Charts December 05, 2013 at 04:31 AM
ATVI Triangulates with Two Patterns. CHRW Tests Key Support Level. Plus EMC, FFIV and TIBX Individual charts are below video. Sorry but your browser doesn't support HTML5 video... Read More
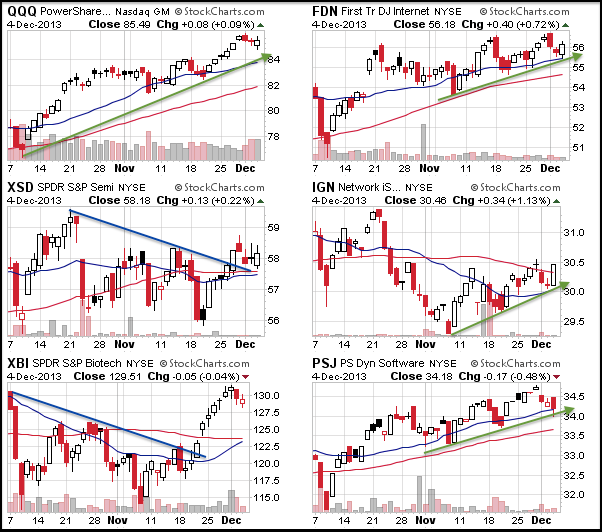
Art's Charts December 04, 2013 at 03:57 AM
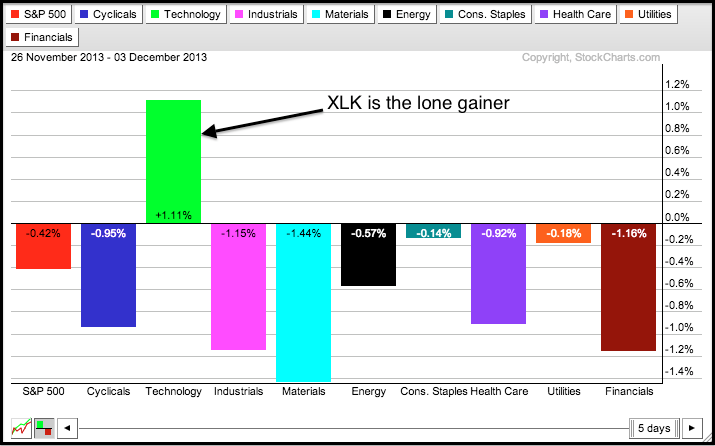
The major index ETFs corrected over the last two days, but this correction turned mixed as the tech sector held up relatively well on Tuesday... Read More
Art's Charts December 03, 2013 at 07:29 AM
After a two week surge at the end of November, stocks started December with some selling pressure. Small-caps and micro-caps led the two week surge, and the Monday pullback. The Russell 2000 ETF (IWM) fell 1% and the Russell Micro Cap ETF (IWC) fell 1.44%... Read More
Art's Charts December 03, 2013 at 07:23 AM
AMT Bounces off Key Retracement with Volume. AN Forms Flag after Wedge Break. Plus CY, FB, PLCM and TER. Individual charts are below video. Sorry but your browser doesn't support HTML5 video... Read More
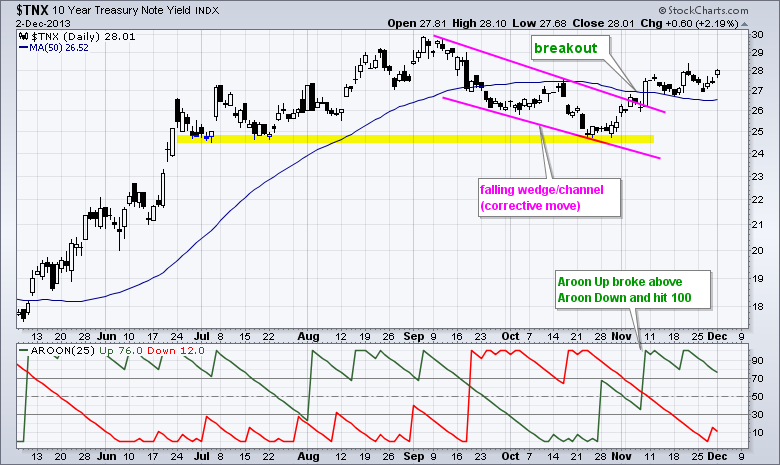
Art's Charts December 02, 2013 at 07:18 AM
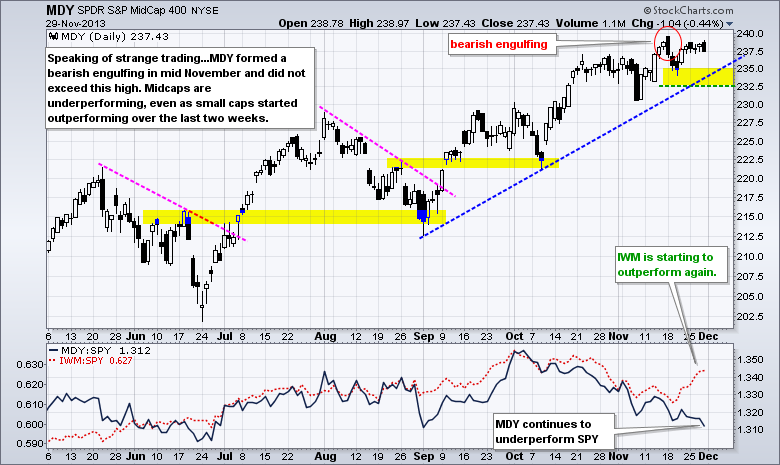
Trading was a bit strange last week, but stocks remain in short-term uptrends and still show no signs of sustained selling pressure. First, the trading week was short because of the Thanksgiving holiday and shortened day on Friday. Second, volume levels were low... Read More