Stocks continued higher in slow trading last week, which is pretty typical for yearend price action. The existing trend is up and prices extend in the direction of the existing trend, but in a much slower manner. Even though it is hard to read into low-volume price movements during a slow week, the bulk of the short-term evidence remains bullish. Small-caps continue to show relative strength this month as IWM and IJR lead the way. Utilities had a good week as money moved out of Treasuries and found its way into these high-yielding alternatives. The Utilities SPDR (XLU), Equal-weight Utilities ETF (RYU) and SmallCap Utilities ETF (PSCU) all surged over 3%. I was also impressed with the performance of the SmallCap Industrials ETF (PSCI), which surged 3.83% last week.
**This chart analysis is for educational purposes only, and should not
be construed as a recommendation to buy, sell or sell-short said securities**
Short-term Overview (Monday, 29-December-2014):
- Breadth is bullish with all five AD Lines hitting new highs.
- Four of the five risk indicators remain positive for stocks.
- SPY broke out with a gap-surge on 18-Dec and key support remains in the 201 area.
- QQQ broke out with a gap-surge on 18-Dec and key support remains in the 102 area.
- IWM broke out with a surge on 17-Dec and key support remains in the 116 area.
- TLT is now in an immediate downtrend with resistance set at 126.
- UUP got a wedge breakout and the Euro got a wedge break down to continue their respective trends.
- USO is firming, but a bearish descending triangle is taking shape because of weak bounces.
- GLD got an oversold bounce, but remains in a downtrend with key resistance in the 116-116.5 area.
The March E-mini S&P 500 (^ESH15) surged on 17-18 December and then worked its way higher the last five days with small gains. This is pretty typical holiday action where the current trend simply extends with small price moves.
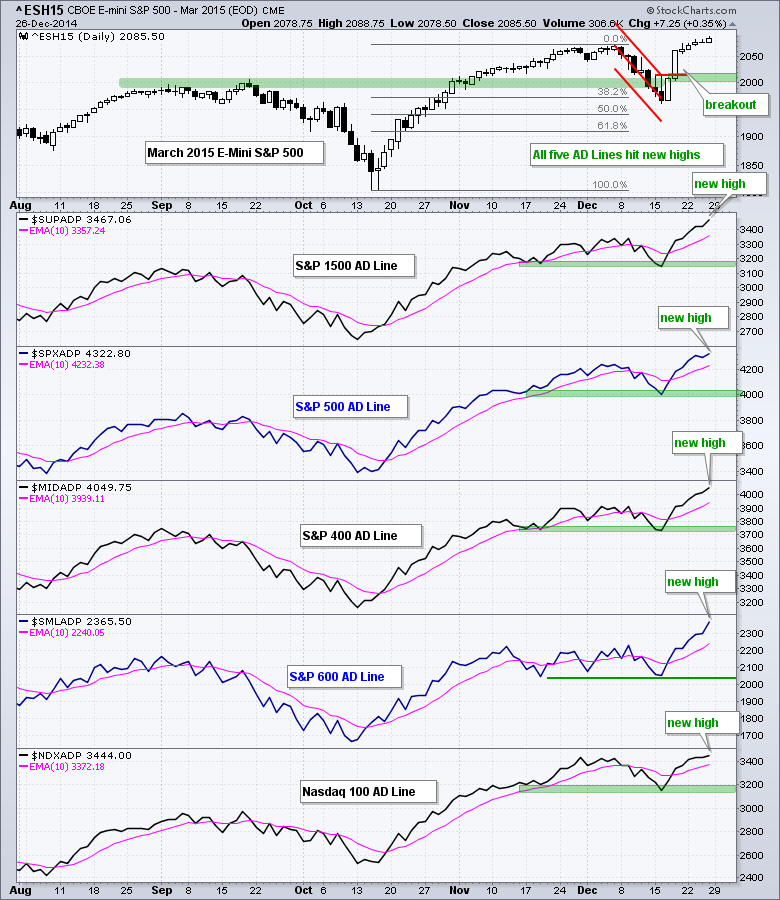
Short-term breadth is bullish as all five AD Lines moved to new highs recently. The Nasdaq 100 AD Line was the last to break above its late November high. The S&P Small-Cap 600 and S&P MidCap 400 AD Lines were the strongest over the last ten trading days. We can measure 10-day strength by looking at the 10-day SMA for AD Percent. This indicator is at 20.10 for the S&P Small-Cap 600 ($SMLADP) and 18.02 for the S&P MidCap 400 ($MIDADP).
Four of the five short-term risk indicators are positive for stocks (green). The biggest move over the last two weeks occurred in Treasury bonds. The 20+ YR T-Bond ETF (TLT) fell sharply and SPY has outperformed TLT since 17-Dec. The 5-year Treasury Yield ($FVX) bottomed at the beginning of December and surged above 1.7% last week. Money is clearly moving out of short-term Treasuries and this is positive for the risk environment.

SPY gapped above resistance and never looked back. The ETF extended above the prior highs and these levels become first support to watch on a throwback. The 206.5-207 area is the first place to watch for a bounce. I will leave key support in the 201 area for now.

**************************************************************
QQQ got a little help from Apple on Friday and broke out of the consolidation around 104-104.5. Last week's lows now become first support in the 104 area. I will leave key support in the 102 area for now. The indicator window shows Apple breaking out with a gap on 18 December and holding this gap.

**************************************************************
IWM broke out first with a surge above 115.5 and continued above its prior highs. Broken resistance in the 117.5-118 area turns first support to watch on a pullback. I will leave key support at 115-115.5 for now. IWM continues to show relative strength and has outperformed SPY the entire month.

**************************************************************
The 20+ YR T-Bond ETF (TLT) fell to support in the 123 area and bounced back above 124 to end Christmas week. The two week trend is down, but the five-six week trend could still be up. I am using the Raff Regression Channel to define the immediate downtrend and will mark resistance at 126. The indicator window shows the 10-YR Treasury Yield ($TNX) breaking above resistance and I am marking support at 21.5 (2.15%). I would be short-term bearish on Treasuries as long as TLT holds below 126 and $TNX remains above 21.5.

**************************************************************
The US Dollar ETF (UUP) held support in the 23.2-23.3 area and surged above resistance at 23.6 to signal a continuation of the uptrend. This move reinforces the support zone. The Euro Index ($XEU) failed at resistance and broke wedge support with a sharp decline. Resistance is marked at 125.50

**************************************************************
The USO Oil Fund (USO) found support in the 20.5-21 area, but the bounces were weak and the ETF formed lower highs. The two week pattern looks like a descending triangle, which is a bearish continuation pattern. A break below support would confirm. I will mark first resistance at 22, a break of which could lead to an oversold bounce.

**************************************************************
The Gold SPDR (GLD) got a big bounce on the 26th, but remains in a downtrend overall. The upper line of the Raff Regression Channel marks the first resistance area in the 115.2 area. I will leave key resistance in the 116-116.5 area for now. The Silver ETF (SLV) has resistance in the 15.5-15.7 area.

***************************************************************
Key Reports and Events (all times Eastern):
Tue - Dec 30 - 09:00 - Case-Shiller 20-city Index
Tue - Dec 30 - 10:00 - Consumer Confidence
Wed - Dec 31 - 07:00 - MBA Mortgage Purchase Index
Wed - Dec 31 - 09:45 - Chicago PMI
Wed - Dec 31 - 10:00 - Pending Home Sales
Wed - Dec 31 - 10:30 - Crude Oil Inventories
Wed - Dec 31 - 12:00 - Natural Gas Inventories
Charts of Interest will be incorporated into the Market Message and Webinar on Tuesdays.
This commentary and charts-of-interest are designed to stimulate thinking. This analysis is not a recommendation to buy, sell, hold or sell short any security (stock ETF or otherwise). We all need to think for ourselves when it comes to trading our own accounts. First, it is the only way to really learn. Second, we are the only ones responsible for our decisions. Think of these charts as food for further analysis. Before making a trade, it is important to have a plan. Plan the trade and trade the plan. Among other things, this includes setting a trigger level, a target area and a stop-loss level. It is also important to plan for three possible price movements: advance, decline or sideways. Have a plan for all three scenarios BEFORE making the trade. Consider possible holding times. And finally, look at overall market conditions and sector/industry performance.
