Stocks were mixed on Monday. The Russell 2000 iShares and S&P MidCap SPDR led with modest gains, while the Dow Diamonds and Nasdaq 100 ETF lagged with fractional losses. Consumer staples and technology were weak. Utilities and consumer discretionary were strong. The Utilities SPDR has been on a tear with a 9% gain the last eight days. My guess is that money is moving out of short-term Treasuries and finding its way into high-yield stocks. Elsewhere, the Home Construction iShares and the Regional Bank SPDR showed strength. The Gold Miners ETF was hammered as gold prices fell back. Programming note: I will be taking off Wednesday and Friday, December 31st and January 2nd. Art's Charts will return on Monday, January 5th. Happy New Year!!
**This chart analysis is for educational purposes only, and should not
be construed as a recommendation to buy, sell or sell-short said securities**
Short-term Overview (Tuesday, 30-December-2014):
- Breadth is bullish with four of five AD Lines hitting new highs.
- Four of the five risk indicators remain positive for stocks.
- SPY broke out with a gap-surge on 18-Dec and key support remains in the 201 area.
- QQQ broke out with a gap-surge on 18-Dec and key support remains in the 102 area.
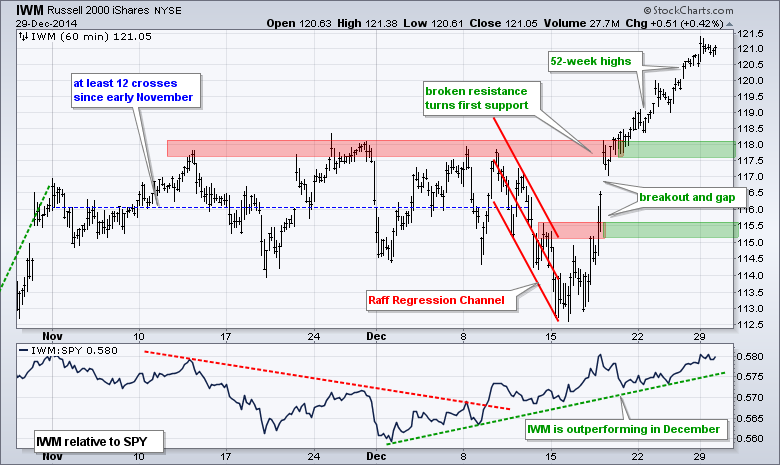
- IWM broke out with a surge on 17-Dec and key support remains in the 116 area.
- TLT surged off support, but has yet to break resistance at 126 to reverse the pullback.
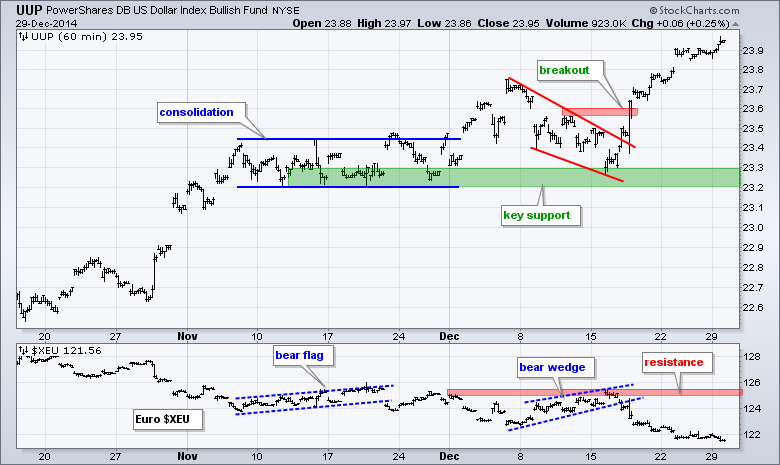
- UUP extended its uptrend with a new high and the Euro extended its downtrend with a new low.
- USO broke descending triangle support to signal a continuation lower.
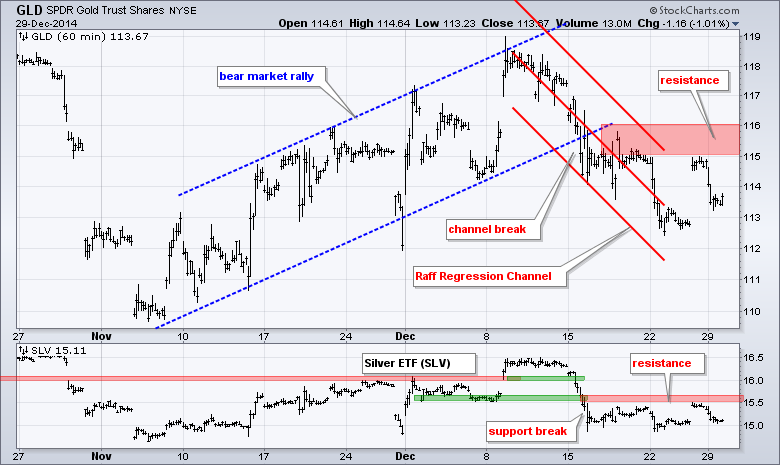
- GLD gave back its oversold bounce and I lowered key resistance to 116.
The March E-mini S&P 500 (^ESH15) edged higher again on Monday and is now up seven of the last eight days. This changes nothing on the chart and keeps me in a bullish holding pattern. The 2000 area still marks first support and I will wait until next week to consider raising it.
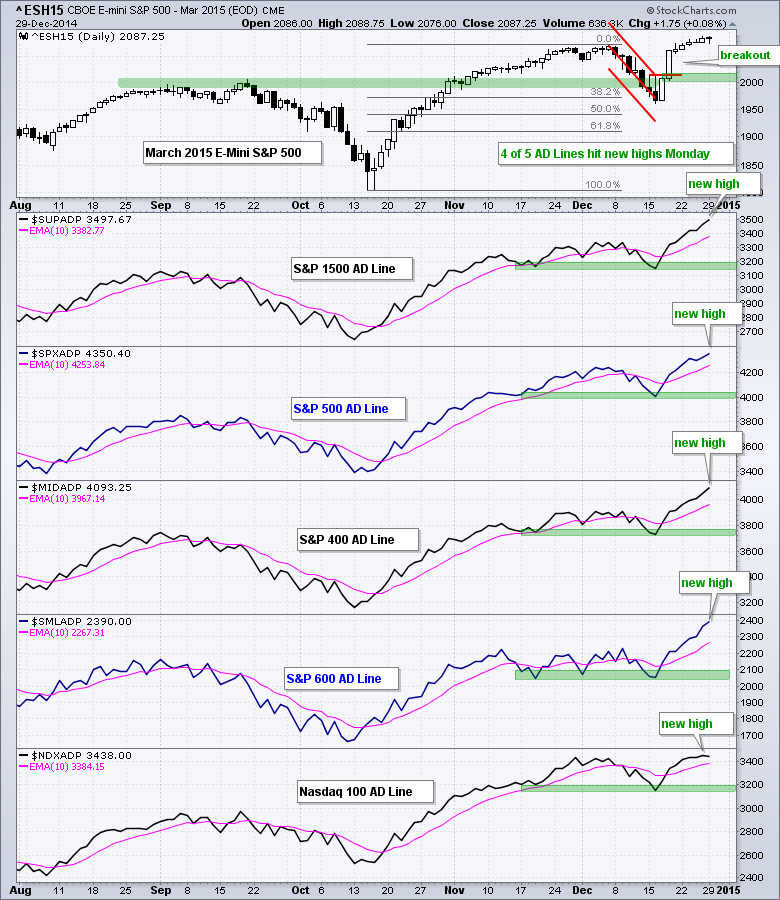
Short-term breadth is bullish as all five AD Lines hit new highs over the last two days. The four S&P AD Lines moved to new highs with AD Percent for the S&P 400 Mid-Cap ($MIDADP) producing the biggest gain (+43.50%). The Nasdaq 100 was under pressure as AD Percent finished negative (-6%). The Nasdaq 100 AD Line was the only one that did not hit a new high and continues to show a little relative weakness.
Four of the five short-term risk indicators are positive for stocks (green). The two stock-related indicators remain strong. The consumer discretionary sector got a lift versus the consumer staples sector as the RCD:RHS ratio surged the last few days. The RSP:SPY ratio hit a new high for the move as the equal-weight S&P 500 continues to outperform the cap-weight S&P 500.
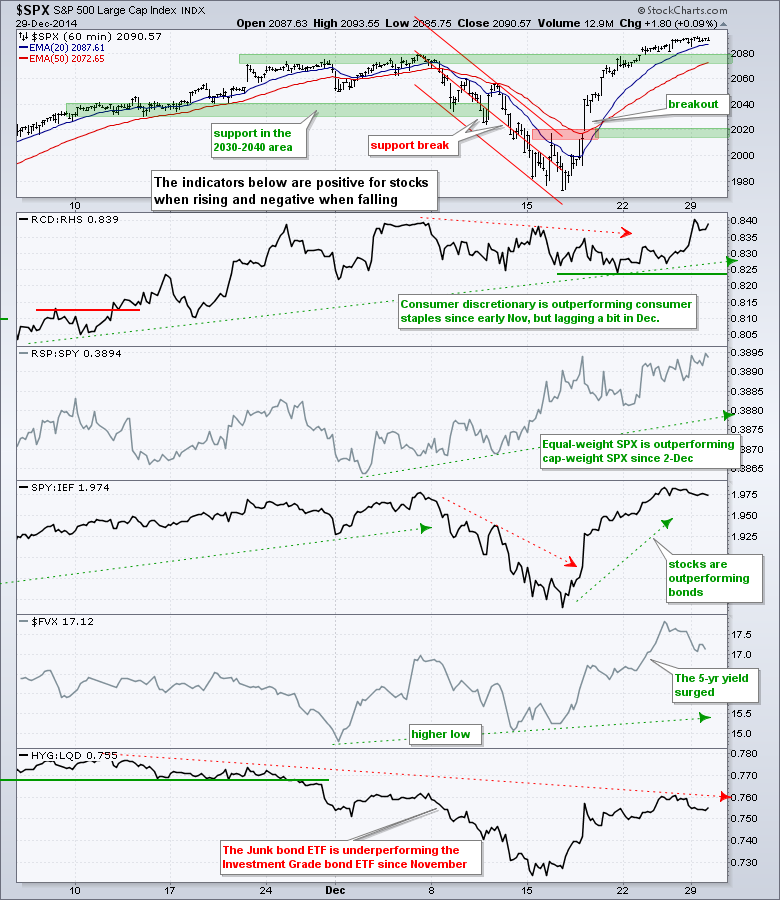
No change. SPY gapped above resistance and never looked back. The ETF extended above the prior highs and these levels become first support to watch on a throwback. The 206.5-207 area is the first place to watch for a bounce. I will leave key support in the 201 area for now.

**************************************************************
No change. QQQ got a little help from Apple on Friday and broke out of the consolidation around 104-104.5. Last week's lows now become first support in the 104 area. I will leave key support in the 102 area for now. The indicator window shows Apple breaking out with a gap on 18 December and holding this gap.

**************************************************************
No change. IWM broke out first with a surge above 115.5 and continued above its prior highs. Broken resistance in the 117.5-118 area turns first support to watch on a pullback. I will leave key support at 115-115.5 for now. IWM continues to show relative strength and has outperformed SPY the entire month.
**************************************************************
The 20+ YR T-Bond ETF (TLT) fell to support last week and then surged off support with a move back above 125. This reinforces the 123 area as key support for the overall uptrend. TLT still remains with a zigzag lower the last eight days and a follow through move above 126 is needed to complete a breakout. Look for the 10-YR Treasury Yield ($TNX) to break 21.5 for confirmation.

**************************************************************
No change. The US Dollar ETF (UUP) held support in the 23.2-23.3 area and surged above resistance at 23.6 to signal a continuation of the uptrend. This move reinforces the support zone. The Euro Index ($XEU) failed at resistance and broke wedge support with a sharp decline. Resistance is marked at 125.50
**************************************************************
The USO Oil Fund (USO) tried to firm, but the bounces were weak and a descending triangle formed. The ETF broke support with a decline on Monday and this signals yet another continuation lower. Last week's highs mark first resistance in the 22 area.

**************************************************************
The Gold SPDR (GLD) bounced on Friday, but fell right back on Monday to confirm the existing downtrend. This decline forged a reaction high at 115 and I will lower key resistance to 116. The Raff Regression Channel, recent highs and a buffer mark resistance here.
***************************************************************
Key Reports and Events (all times Eastern):
Tue - Dec 30 - 09:00 - Case-Shiller 20-city Index
Tue - Dec 30 - 10:00 - Consumer Confidence
Wed - Dec 31 - 07:00 - MBA Mortgage Purchase Index
Wed - Dec 31 - 09:45 - Chicago PMI
Wed - Dec 31 - 10:00 - Pending Home Sales
Wed - Dec 31 - 10:30 - Crude Oil Inventories
Wed - Dec 31 - 12:00 - Natural Gas Inventories
Charts of Interest will be incorporated into the Market Message and Webinar on Tuesdays.
This commentary and charts-of-interest are designed to stimulate thinking. This analysis is not a recommendation to buy, sell, hold or sell short any security (stock ETF or otherwise). We all need to think for ourselves when it comes to trading our own accounts. First, it is the only way to really learn. Second, we are the only ones responsible for our decisions. Think of these charts as food for further analysis. Before making a trade, it is important to have a plan. Plan the trade and trade the plan. Among other things, this includes setting a trigger level, a target area and a stop-loss level. It is also important to plan for three possible price movements: advance, decline or sideways. Have a plan for all three scenarios BEFORE making the trade. Consider possible holding times. And finally, look at overall market conditions and sector/industry performance.
