Art's Charts February 27, 2015 at 04:52 AM
It was a mixed day on Wall Street. Large-cap techs and small-caps led with modest gains. Mid-caps and the equal-weight S&P 500 lagged with modest losses. Energy got slammed again as oil fell... Read More
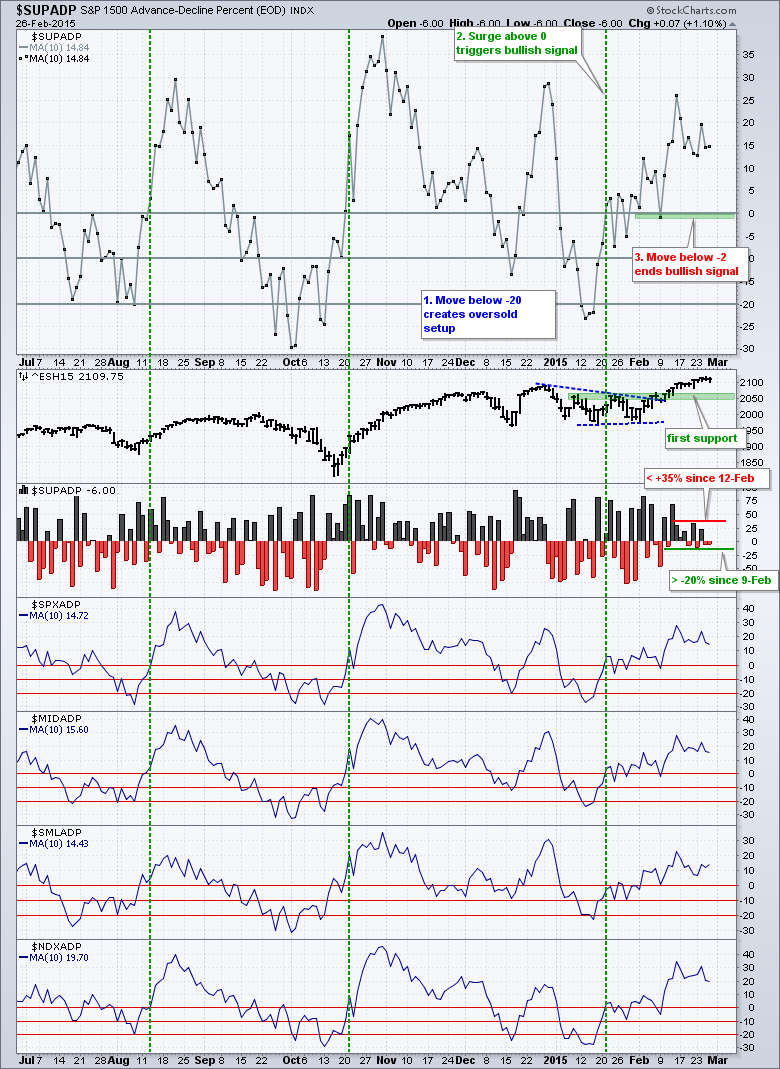
Art's Charts February 26, 2015 at 04:51 AM
The S&P 500 moved to a new high during the session, but selling pressure hit in the afternoon and the index closed with a fractional loss. Wednesday's price action is the first negative price action we have seen in a while... Read More
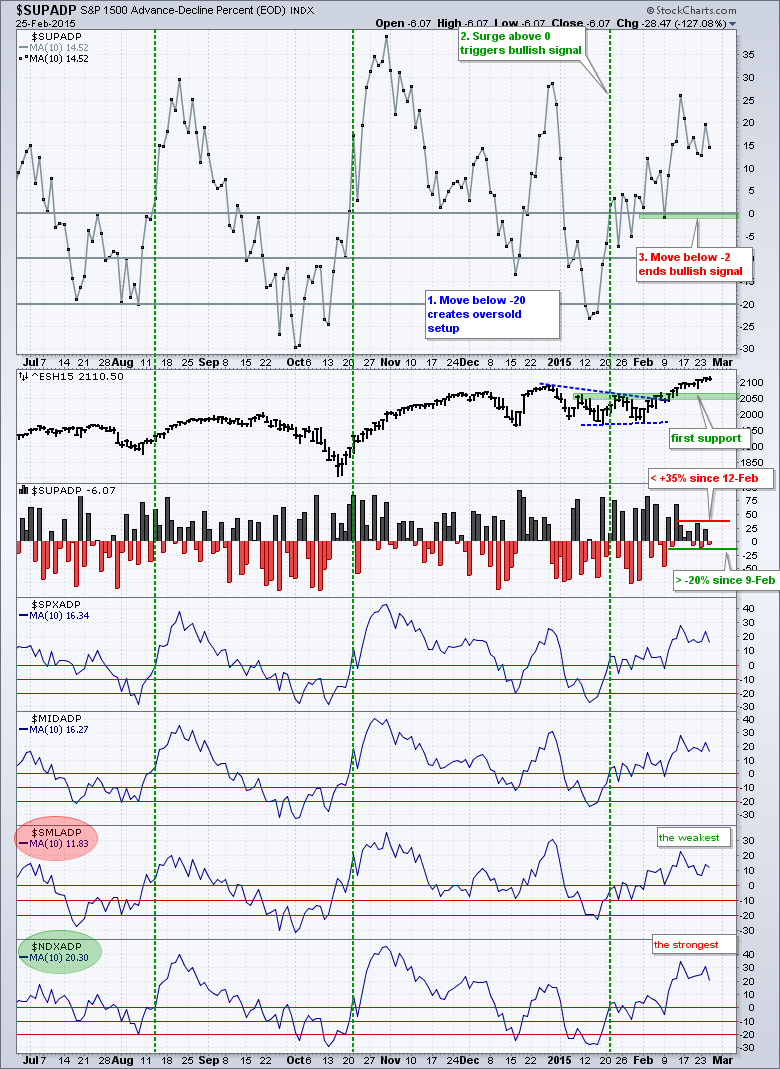
Art's Charts February 25, 2015 at 05:01 AM
Stocks started the day strong as the S&P 500 surged above 2115 in the first ninety minutes. The index pulled back to the 2110 area around midday and rebounded in the afternoon to close above 2115. Once again, the gains for the day were modest across the board. SPY gained a mere ... Read More
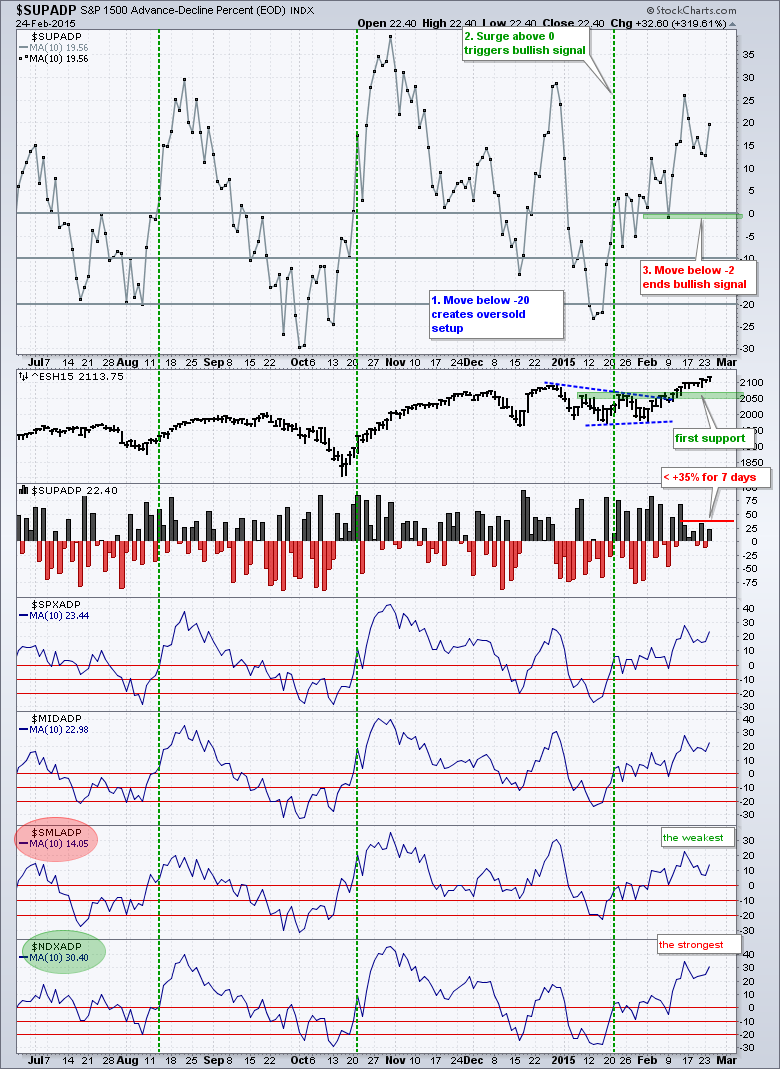
Art's Charts February 24, 2015 at 04:34 AM
There it is again! Stocks started the day weak as the S&P 500 dropped to the 2104 level in the first hour. After choppy trading most of the day, the index surged in the final hour and closed a whisker below 2110... Read More
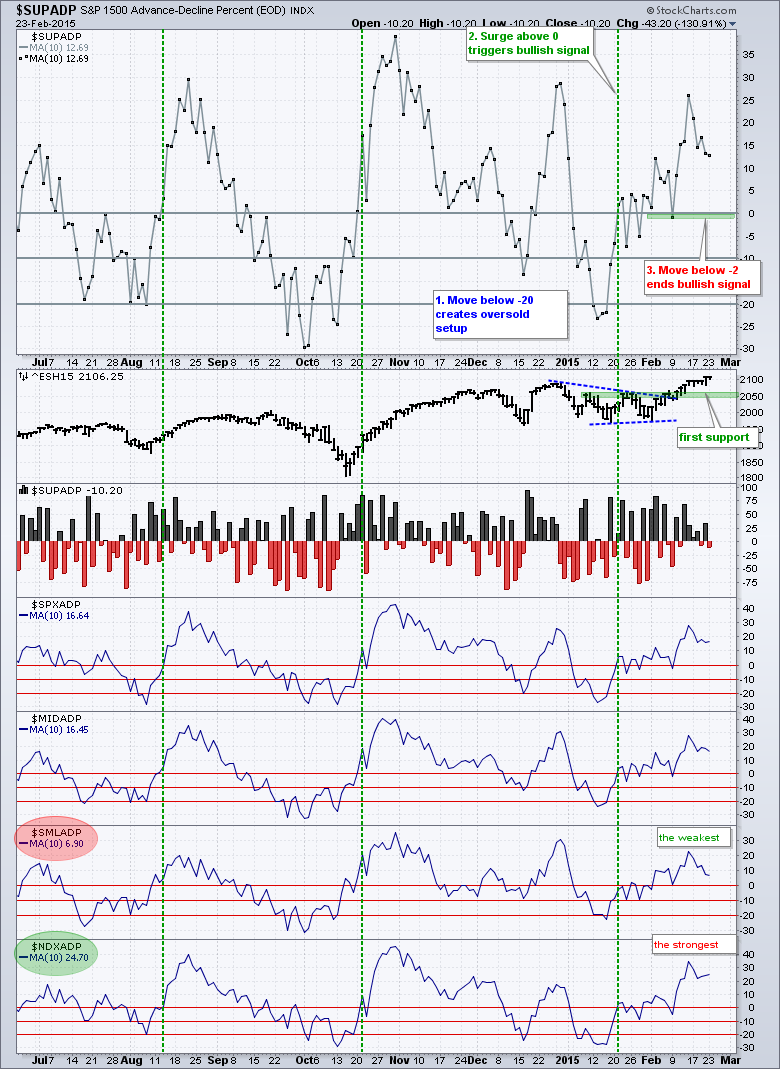
Art's Charts February 23, 2015 at 05:17 AM
Even though the major index ETFs are short-term overbought, stocks continue to exhibit bullish price action overall... Read More
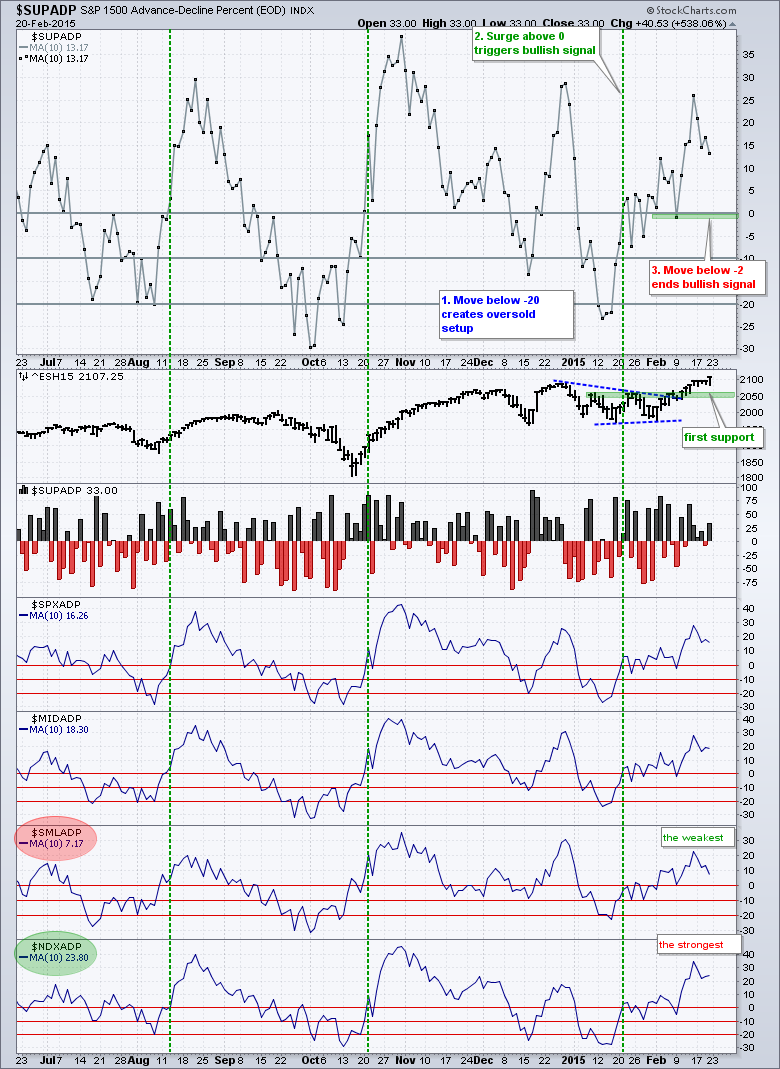
Art's Charts February 20, 2015 at 05:14 AM
The S&P 500 has been flat as a pancake the last three days, but the Nasdaq 100 and Russell 2000 continued higher. Note that the S&P 500 is up .02% this week, the Nasdaq 100 is up .63% and the Russell 2000 is up .39%... Read More
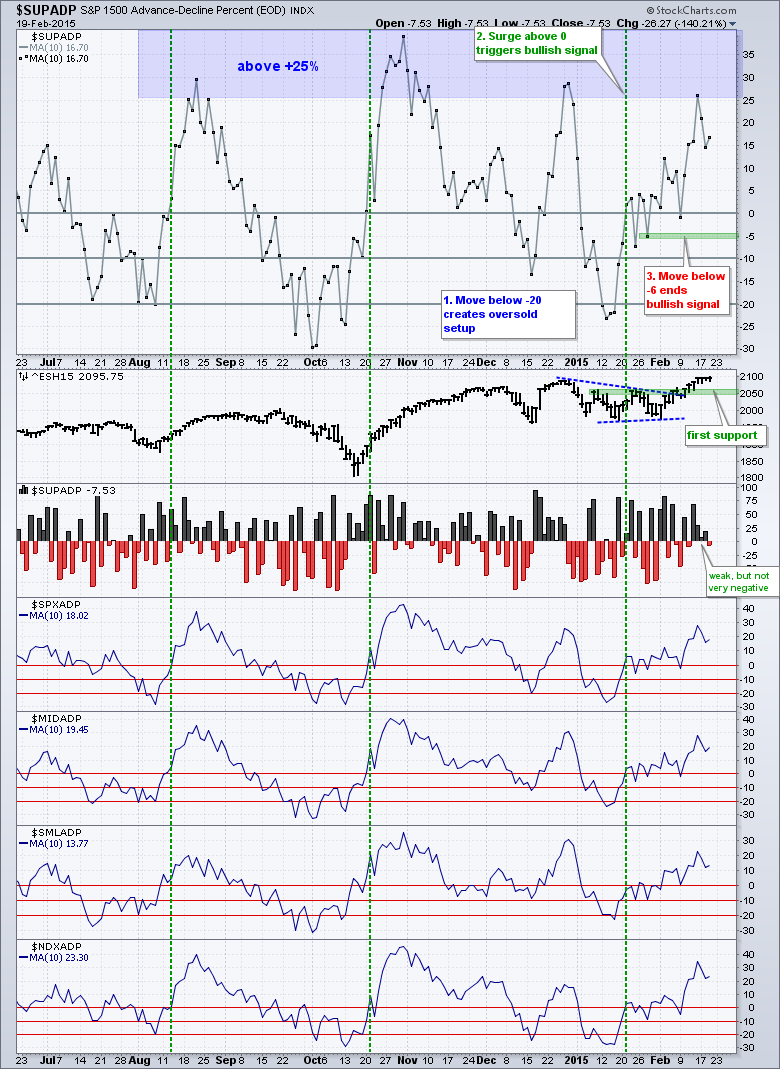
Art's Charts February 19, 2015 at 05:45 AM
Stocks started the day with some mild selling pressure, firmed during the day and then rallied in the final two hours. The rally, however, was not that strong and the major index ETFs closed mixed on the day. QQQ was up a fraction and DIA was down a fraction... Read More
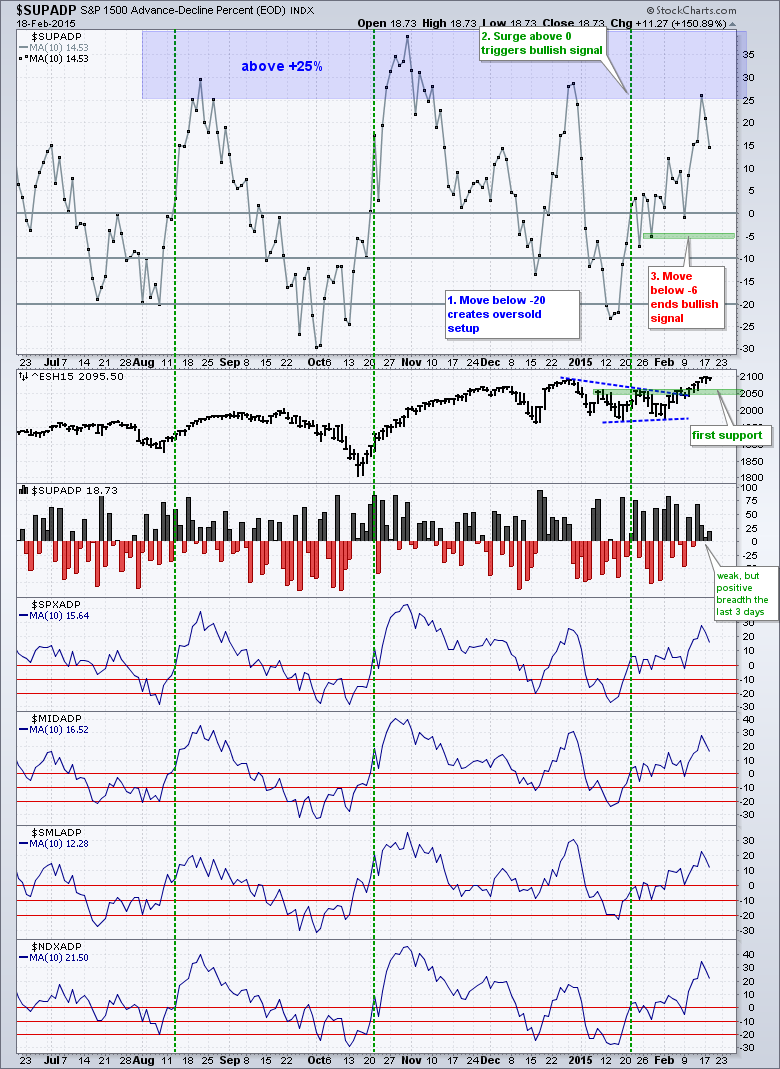
Art's Charts February 18, 2015 at 05:49 AM
Stocks opened strong, dipped in the afternoon and then finished strong. Once again, the price action during the day is bullish and buying pressure continues to assert itself. The major index ETFs closed with fractional gains. The sectors were mixed with small gains and losses... Read More
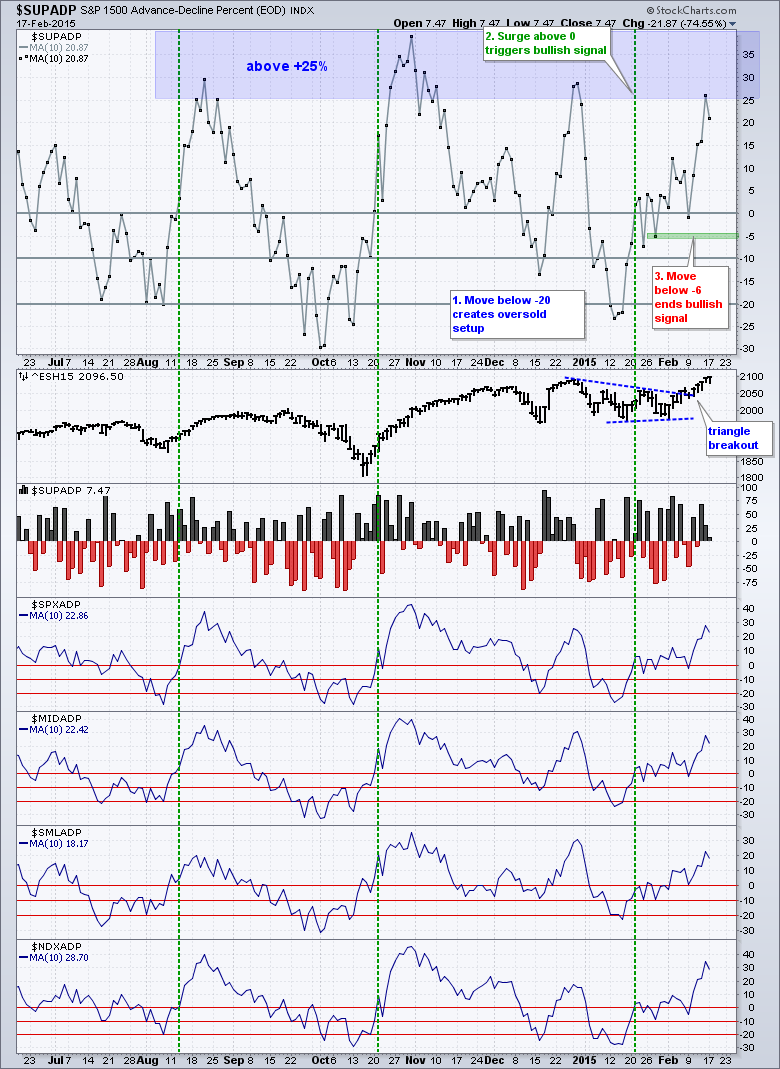
Art's Charts February 17, 2015 at 05:17 AM
Stocks continued higher last week with the S&P 500, Nasdaq 100 and Russell 2000 hitting new highs on Friday. Techs led the rally as xrt6QQQ gained 3.67% and XLK surged 3.77%. Utilities did not partake as Treasury yields rose again last week... Read More
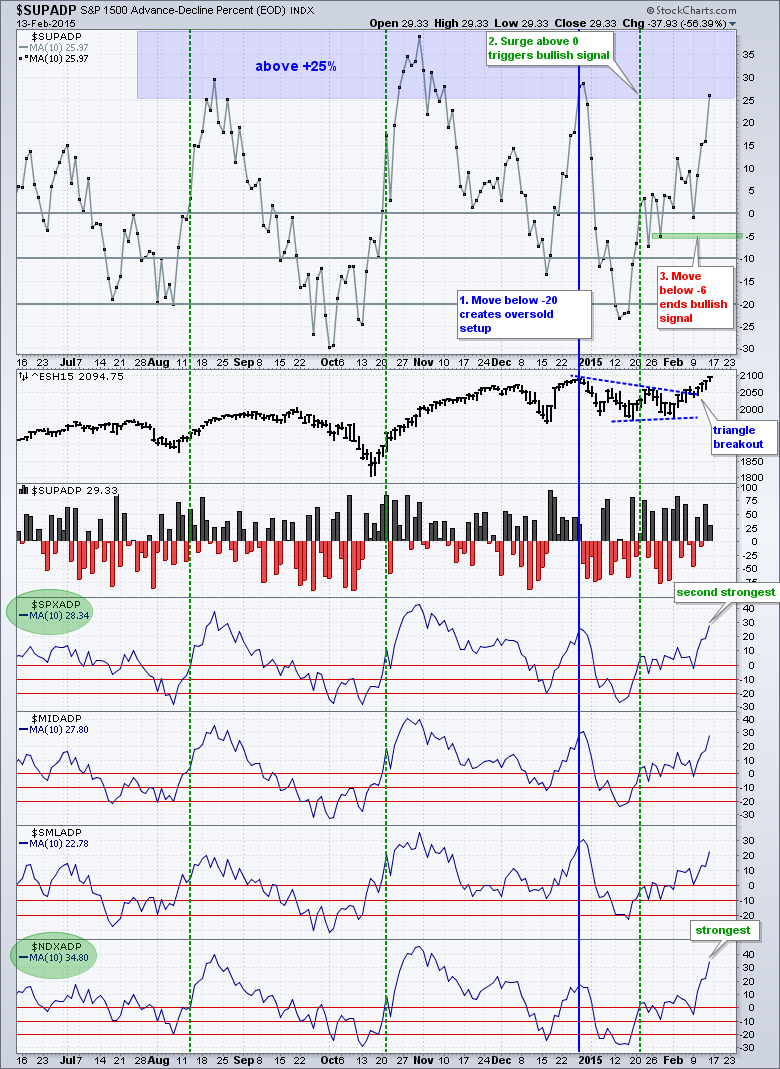
Art's Charts February 13, 2015 at 04:39 AM
Stocks put in another positive day with bullish price action. The S&P 500 opened strong with a surge above 2080 and then worked its way higher to close at 2088. Once again, we are seeing the ability to start strong and finish strong... Read More
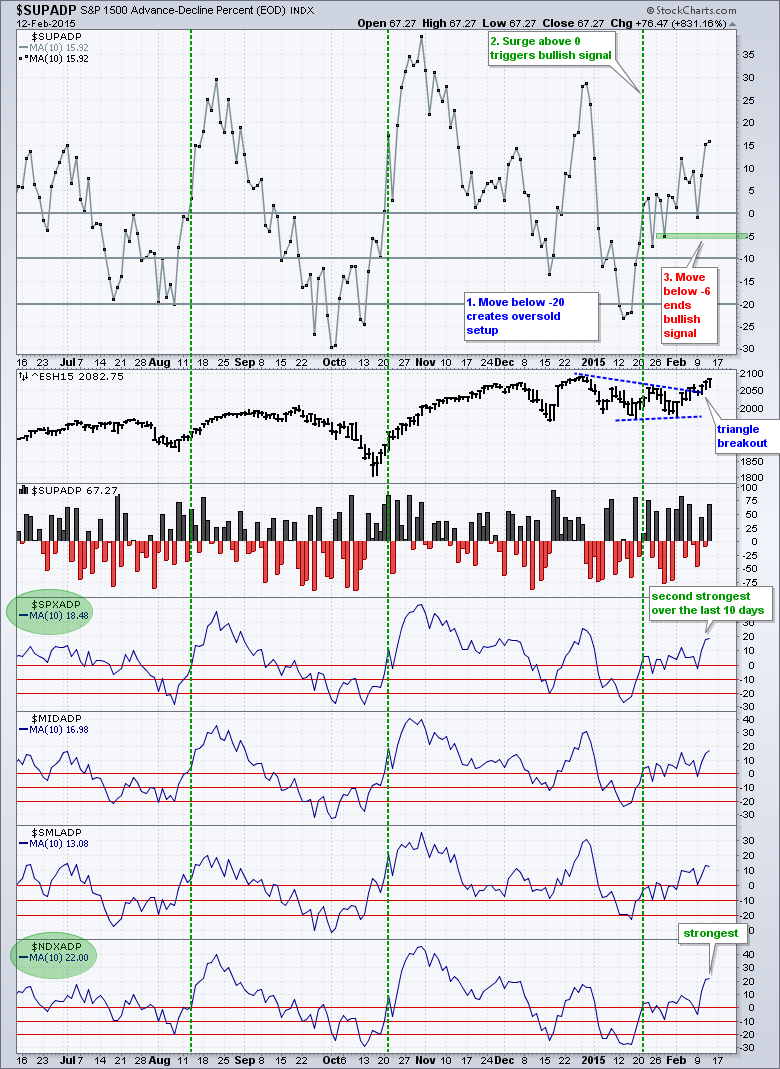
Art's Charts February 12, 2015 at 04:30 AM
It was a choppy day on Wall Street with QQQ edging higher and IWM edging lower. The sectors were mixed with techs and consumer staples producing small gains. Utilities took another hit as the Utilities SPDR (XLU) fell over 2%... Read More
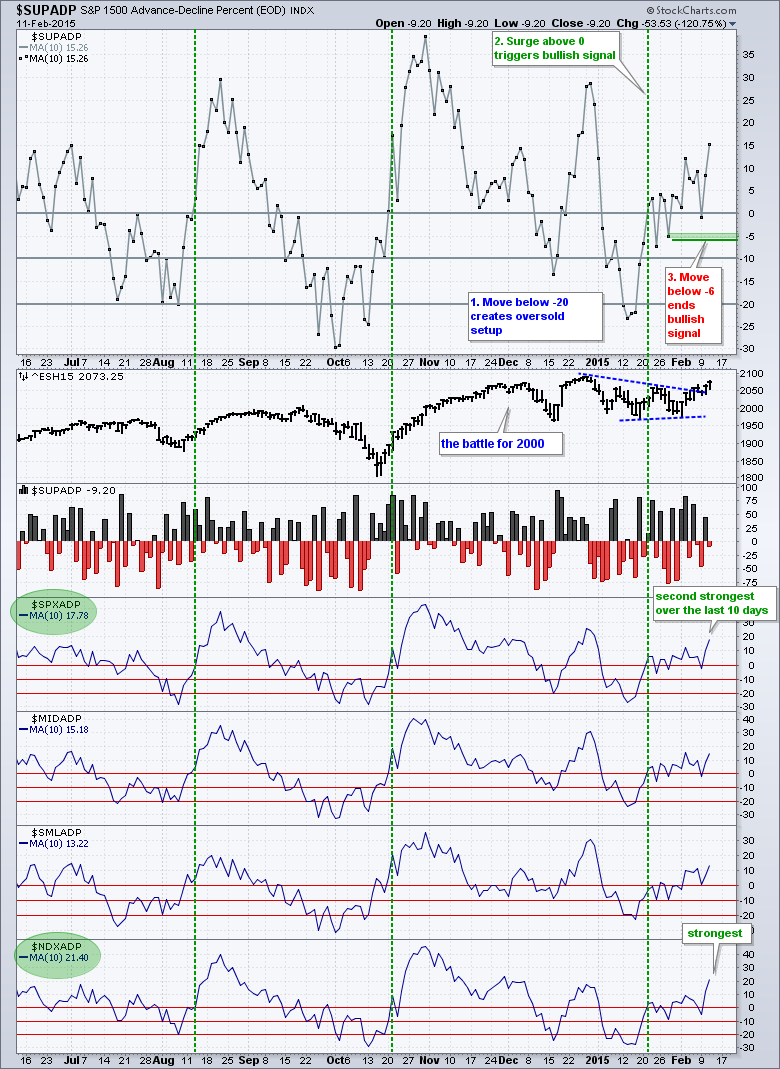
Art's Charts February 11, 2015 at 04:37 AM
Stocks put in another good performance on Tuesday. The S&P 500 opened strong and worked its way higher the rest of the day. As with last week, this is the kind of price action the bulls want to see. The consumer discretionary, healthcare and technology sectors led the way... Read More
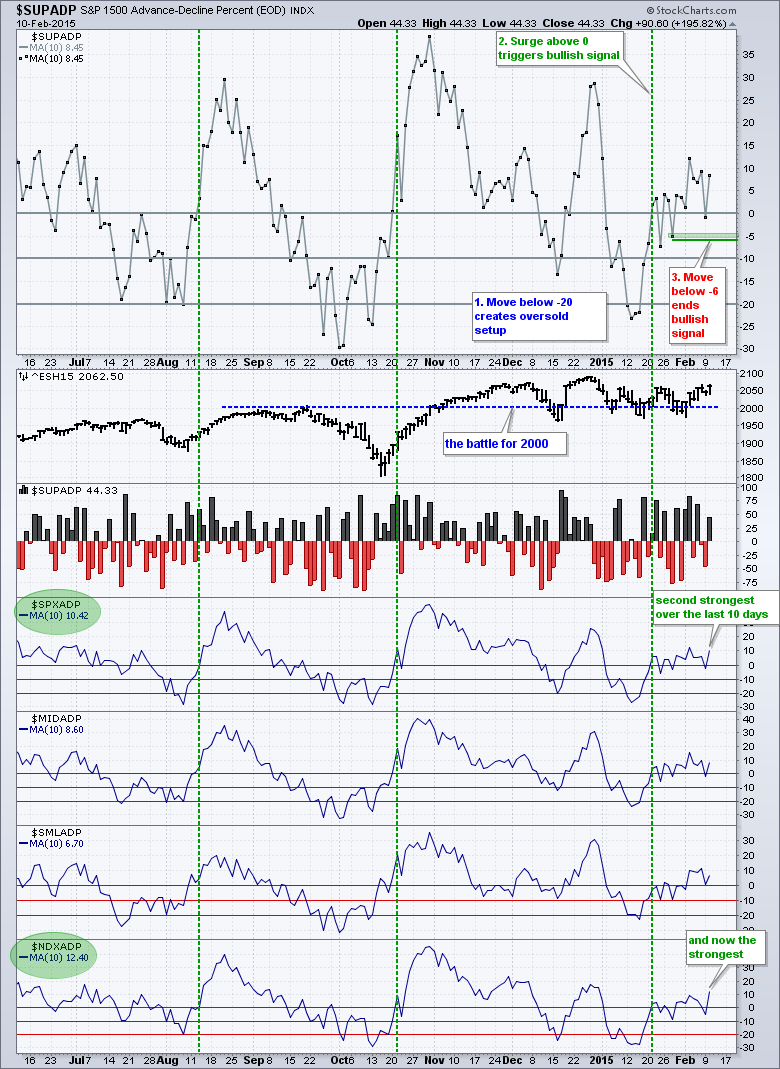
Art's Charts February 10, 2015 at 04:03 AM
Selling pressure extended on Monday, but the selling pressure was rather tame and the losses were modest. A little selling pressure after a big advance last week is normal at this stage. Healthcare, utilities and consumer staples led the sectors lower... Read More
Art's Charts February 09, 2015 at 05:25 AM
Stocks were hit with some selling pressure on Friday, but the week as a whole showed some pretty positive price action. SPY began its advance on Monday, gapped up on Tuesday and then worked its way higher until Friday morning... Read More
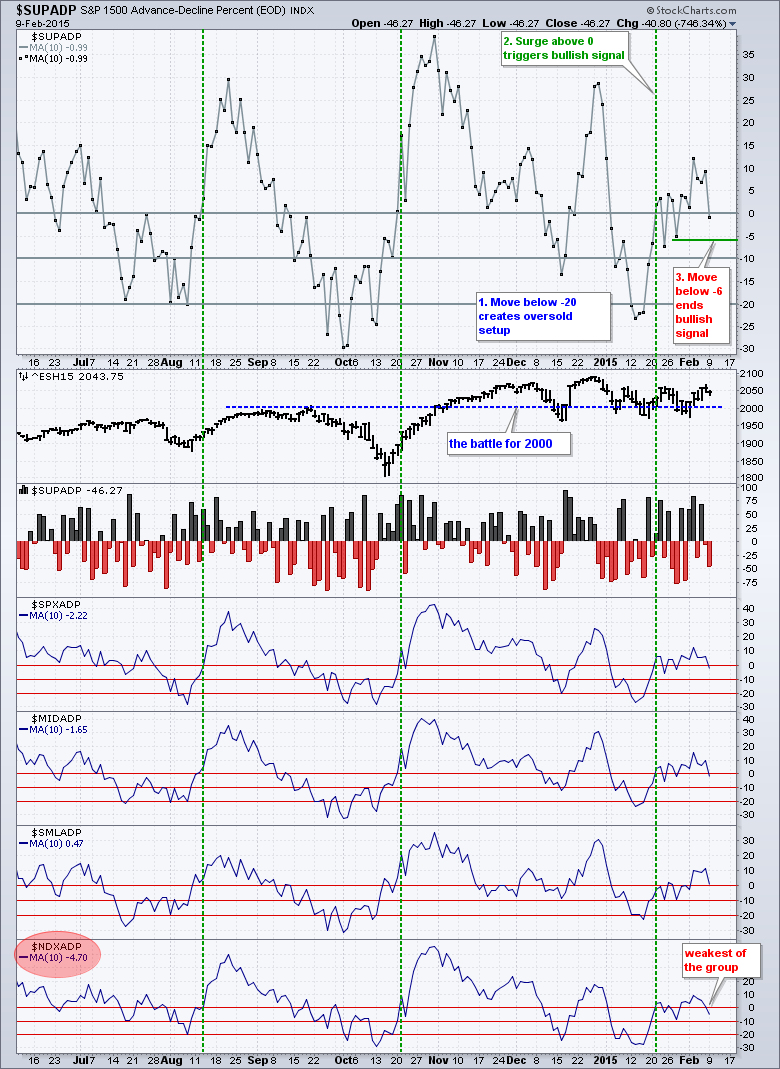
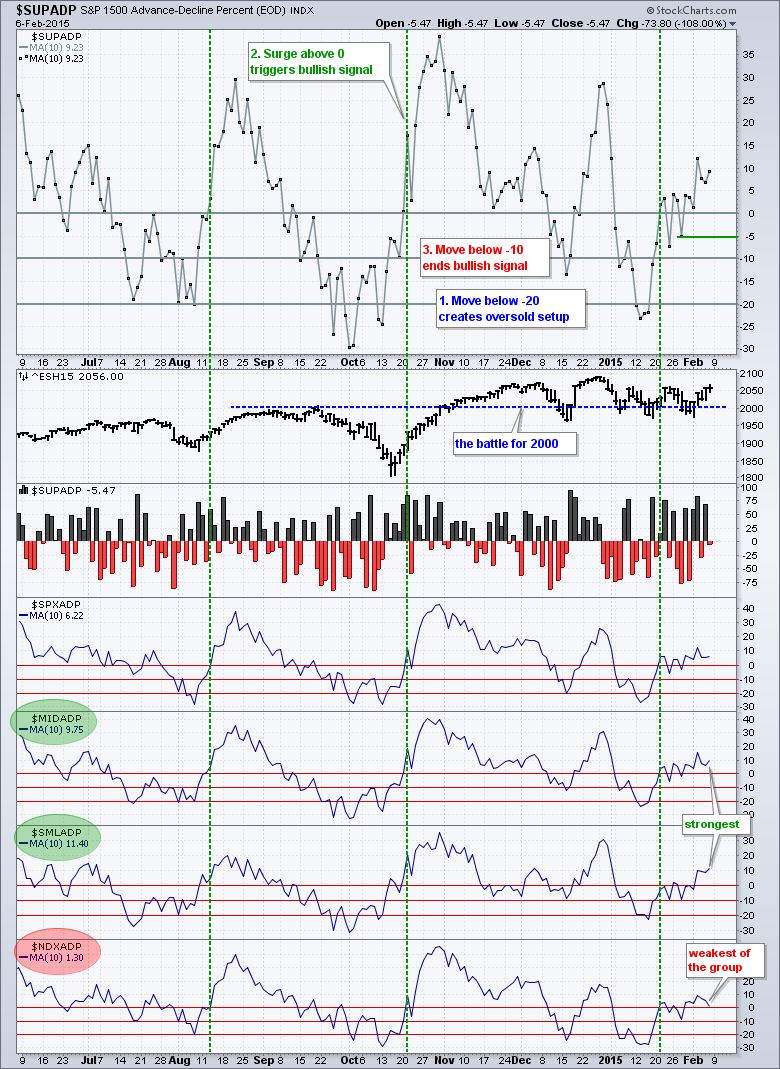
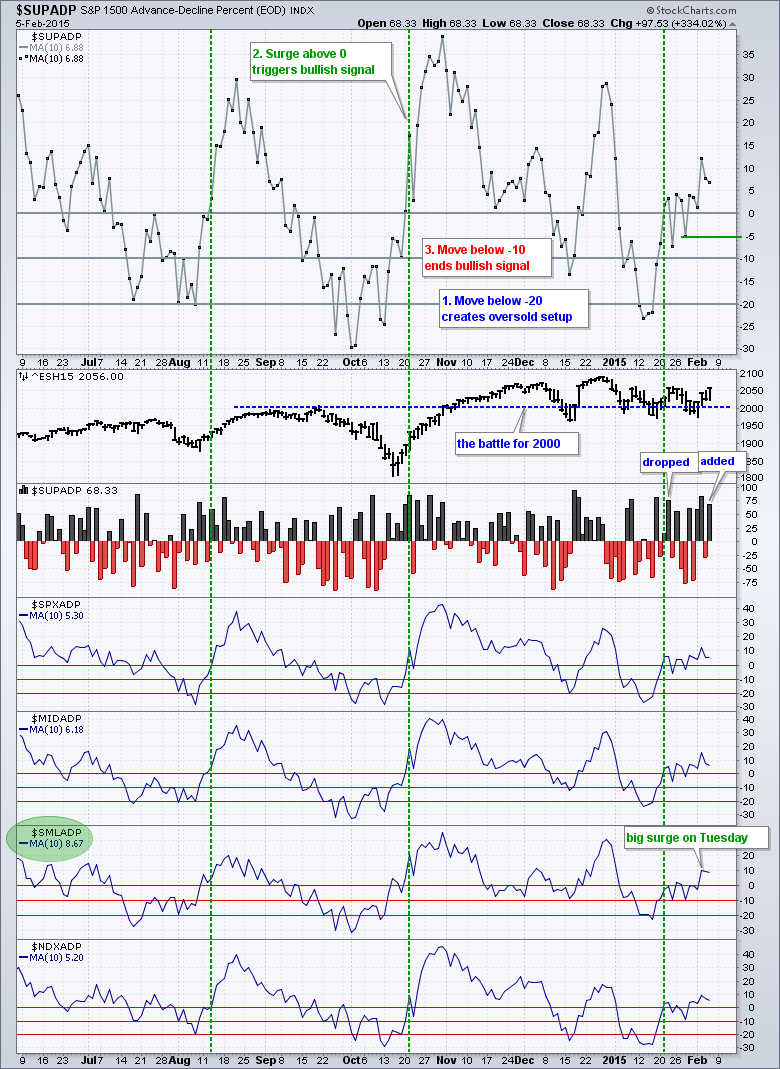
Art's Charts February 06, 2015 at 12:16 PM
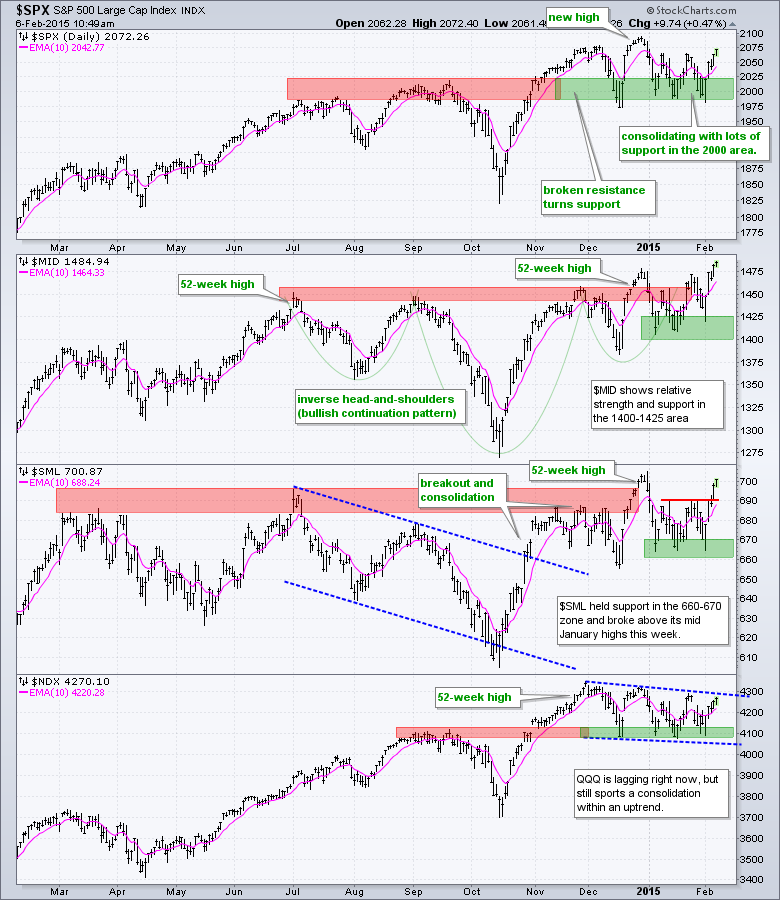
-- S&P 500 and Nasdaq 100 Make Breakout Bids (creating unique charts) -- High-Low Percent Indicators Stay Bullish -- Bounce in T-Yields Lifts Financials -- XSD Shows Chart Strength (finding ETF holdings) -- Materials Sector Springs to Life -- Treasury Yields Bounce -- Dollar Jump... Read More
Art's Charts February 06, 2015 at 04:34 AM
The S&P 500 surged late Monday and early Tuesday with a move from 1990 to 2040, and then worked its way higher. This is positive price action because the index held the surge and continued higher. Small-caps led the way on Thursday with IWM gaining 1.29%... Read More
Art's Charts February 05, 2015 at 04:37 AM
After a surge from 1985 to 2050, trading in the S&P 500 turned choppy on Wednesday with a rather tight range. There was, however, some late selling pressure as the index dropped from 2053 to 2040 in the final 30 minutes. Must have been some news event hitting the tape... Read More
Art's Charts February 04, 2015 at 05:10 AM
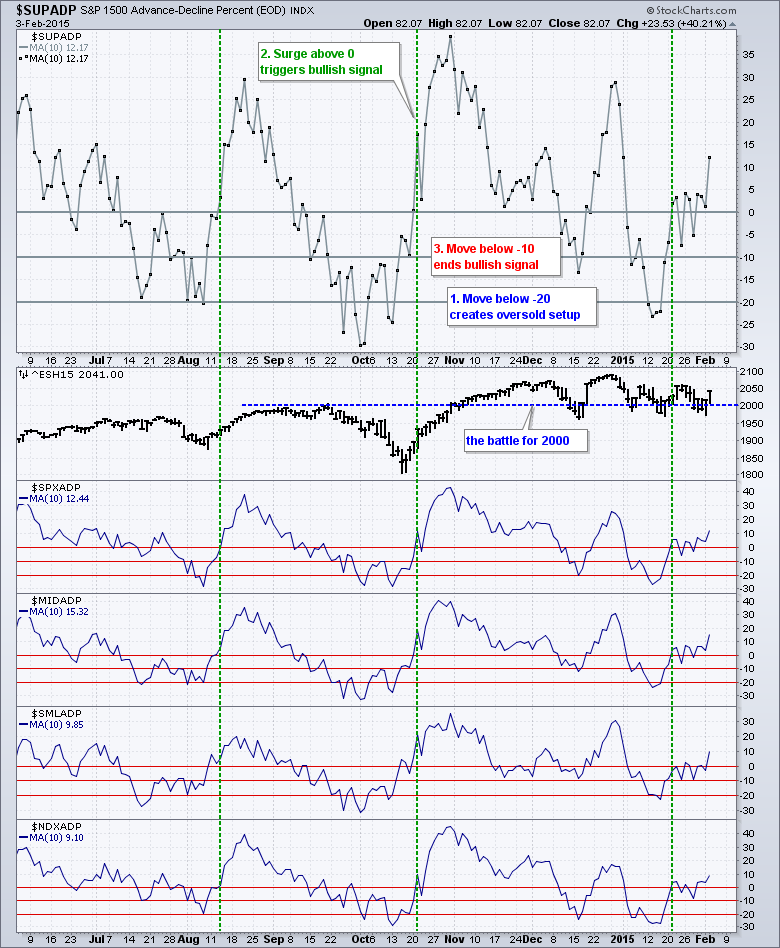
Stocks started strong with a surge on the open, traded flat for a few hours and then moved higher the entire afternoon. The ability to open strong and finish strong is positive and the S&P 500 finished strong the last two days. Energy led the way as oil got an oversold bounce... Read More
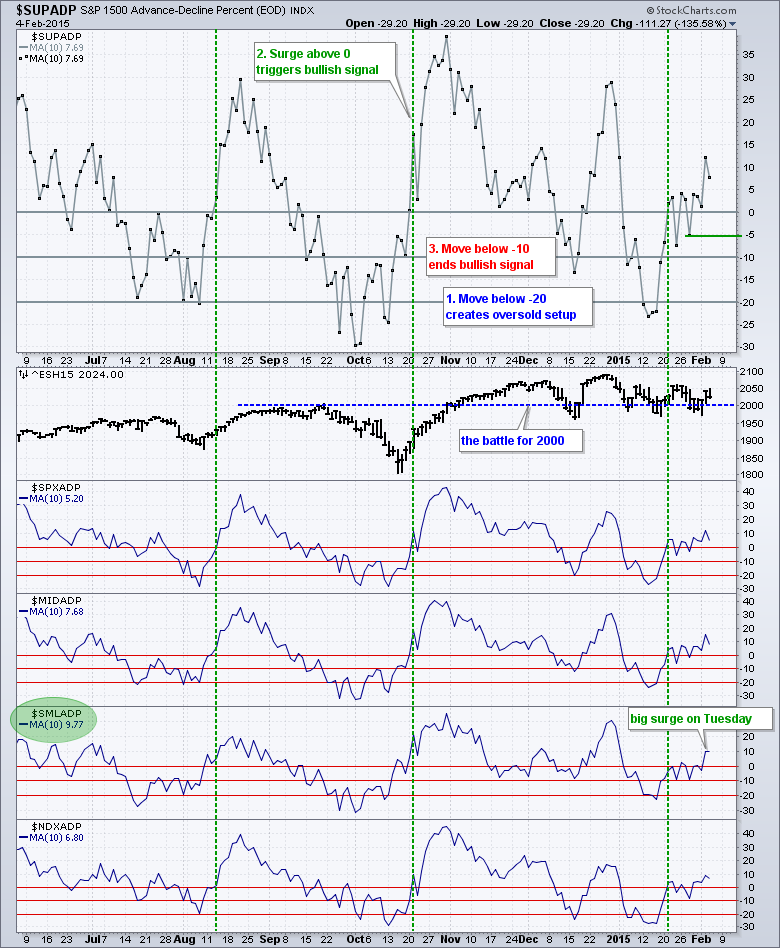
Art's Charts February 03, 2015 at 07:29 AM
Stocks started the day weak with selling pressure on the open, but quickly firmed around 10AM and the S&P 500 surged above 2000 before lunch. After an early afternoon swoon, buyers stepped in again and pushed this key benchmark back above 2000... Read More
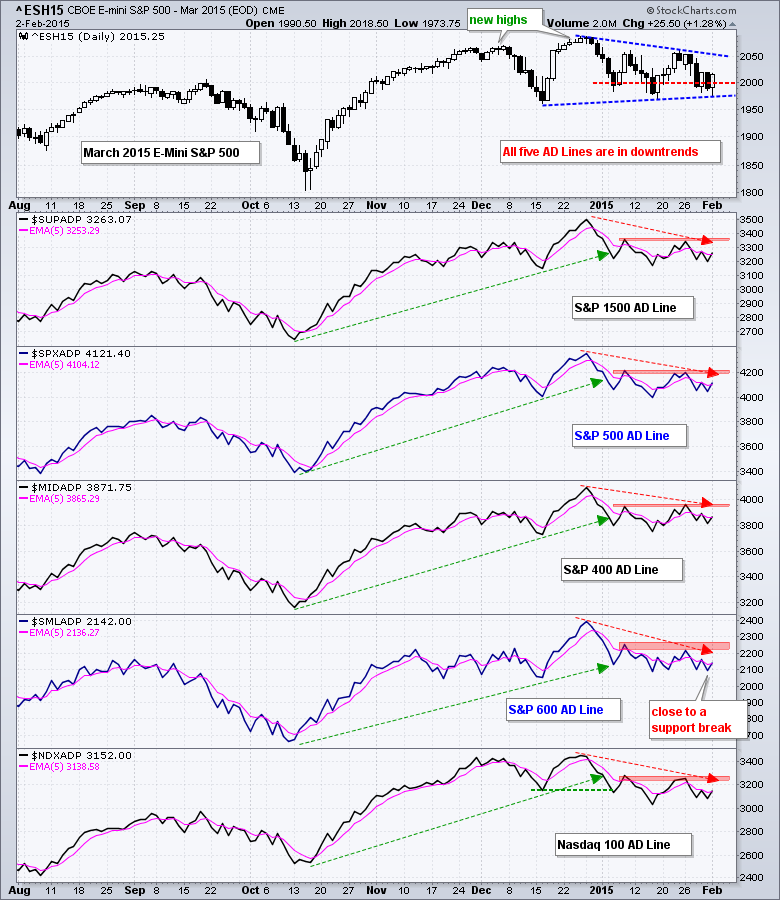
Art's Charts February 02, 2015 at 05:48 AM
Stocks took it on the chin last week with large-caps leading the way lower. QQQ and the S&P 100 ETF (OEF) lost around 3% last week. Big banks and big techs led the way lower as XLK and XLF lost over 3%. The Consumer Discretionary SPDR (XLY) held up relatively well with a 1... Read More