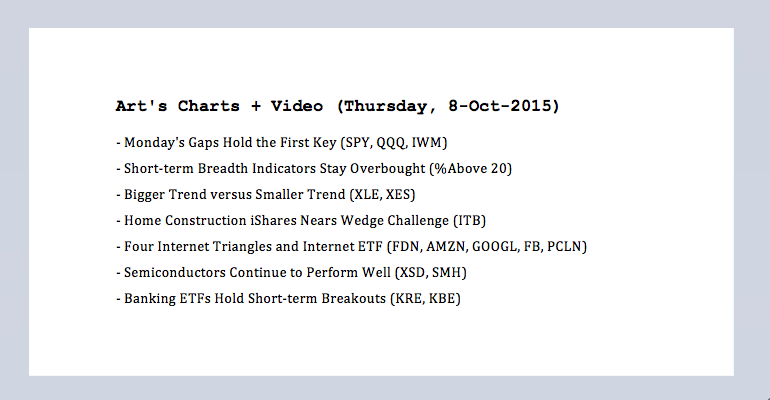
Monday's Gaps Hold the First Key
I am still working under the assumption that bigger trend is down after the August break down. Furthermore, SPY and QQQ are in the midst of counter trend moves denoted by a rising channel. The channel lines are based on the closing levels and highlight the upward trajectory since late August. IWM, in contrast, formed a lower low in late September and does not have a rising channel at work (relative weakness). Short-term, I am watching Monday's gap and the short-term PPO (5,30,5). The gap is holding and the PPOs are still rising (above their signal lines). A filling of Monday's gap would provide the first sign of a bearish short-term reversal. Note: ST = Short-term, LT = long-term and MT = medium-term.
Short-term Breadth Indicators Stay Overbought
Assuming the bigger trend is down, I am interested in short-term overbought situations that may foreshadow a bearish reversal. As noted the last two days, I am using the percentage of stocks above the 20-day EMA for the major index ETFs as a short-term breadth indicator. It is overbought when above 70% and this provides the setup. The setup turns into a bearish trigger when the indicator moves back below 60%. As with all models and systems, it is not perfect and there will be losing trades. The chart below shows short-term overbought conditions for the S&P 500, S&P MidCap 400 and S&P Small-Cap 600. The Nasdaq 100 %Above 20-day EMA (!GT20NDX) finished at 69% and has yet to become overbought. It is, however, pretty darn close. The green lines on the right mark 60% and a move below this level would signal a down turn in these breadth indicators.
ITB Nears Wedge Challenge
The Home Construction iShares (ITB) got a nice bounce over the last six days, but falling wedge defines the overall downtrend. Even though it is possible that this wedge is a correction after a 52-week high in mid April, the wedge is clearly falling and the trend is down as long as it falls. The gap down and wedge trend line mark the first area to watch for a potential trend-changing event. Note that the wedge trend lines are based on closing prices. I am also watching the long-term PPO (20,120,1) for a move back into positive territory.
Bigger Trend versus Smaller Trend
The big-trend/small-trend dilemma is present in several ETFs. This dilemma starts with a bigger downtrend and a smaller uptrend, and the dilemma grows as the smaller uptrend strengthens. A smaller uptrend sometimes evolves into a bigger uptrend, but we are not yet at that stage. I currently see this dilemma with XLE, XES, KRE, KBE, SMH, XSD and FDN, and will cover these charts today.
The medium-term PPO (10,60,1) and long-term PPO (20,120,1) are used to gauge the bigger trend in a less subjective manner. The trend is considered down as long as both are in negative territory. Note that these two PPOs are negative for the seven ETF symbols above. The dilemma comes about when a smaller uptrend takes hold and this uptrend shows material strength. What to do? My feeling is that chartists either pick a bottom or wait for a pullback. In other words, buy XES after Friday's bullish engulfing or SMH after the gap-breakout on September 30th. Even though the bigger trends were down, these were low risk entry points based on a short-term bullish event. In addition, SMH showed relative strength in September and energy shares were intriguing because oil held up well in September. Both XES and SMH are up sharply this week, but the bigger trend is still down. At this stage, I think it prudent to wait for the next pullback or short-term setup. Chasing the market is rarely a good idea. For those with positions, keep in mind that the bigger trend can pull trump at any time and it might be a good idea to consider lightening up.
Four Internet Triangles and FDN
The Internet ETF (FDN) gapped up and held this gap on Monday. Even though there are dozens of moving parts in this ETF (stocks), the top four stocks are in uptrends overall and formed triangles the last two months. Upside breakouts in these stocks would be bullish for the ETF. FDN gapped above 68.5 on Monday and this gap is holding. The Raff Regression Channel and gap low mark support in the 68-68.5 area. A close below 68 would reverse the short-term upswing.
Semiconductors Continue to Perform Well
The Semiconductor ETF (SMH) broke out with a gap-surge on 30-Sept and moved above its mid September high. I talked about benchmark highs and benchmark lows in Tuesday's webinar (recording here). The mid September high marks a benchmark high because the market turned down in mid September and QQQ formed a peak here. QQQ remains below this high and SMH moved above this high. This means SMH shows relative chart strength when compared to QQQ, which could be considered its benchmark.
Banking ETFs Hold Short-term Breakouts
The Regional Bank SPDR (KRE) perked up with a three day reversal and a wedge breakout. Once again, Monday's gap holds the short-term key and a close below 40.4 would negate this signal. Despite this short-term breakout, I am not ready to turn bullish on the bigger trend just yet. The medium-term PPO (10,60,1) and long-term PPO (20,120,1) are both negative. This is my objective take on the bigger trend and the trend is down when both are negative. The short-term PPO (gray) is positive and rising, but I would be careful because the bigger trend is still down. A move back into negative territory by PPO (5,30,1) would signal an end to this short-term uptrend.

****************************************
Thanks for tuning in and have a good day!
--Arthur Hill CMT
Plan your Trade and Trade your Plan
*****************************************


