Art's Charts December 29, 2015 at 02:48 PM
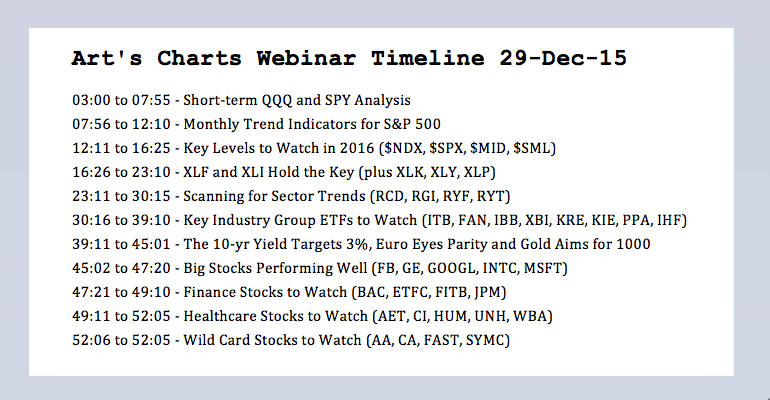
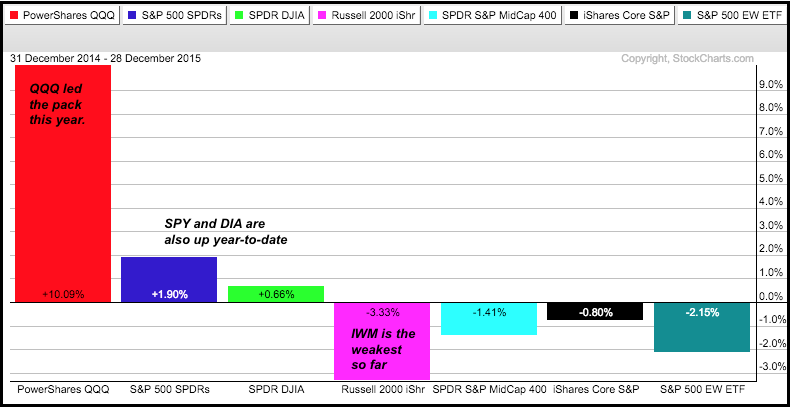
Monthly Trend Indicators for S&P 500 // Key Levels to Watch in 2016 ($NDX, $SPX, $MID, $SML) // The 10-yr Yield Targets 3% // Euro Eyes Parity // Gold Aims for 1000 // Webinar Topics, ETFs and Stocks //// Today's commentary and webinar will use long-term charts to extrapolate som... Read More
Art's Charts December 29, 2015 at 05:00 AM
This is just a short update for the Nasdaq 100 ETF (QQQ) and the S&P 500 SPDR (SPY). I will post a 2016 preview later today using monthly charts to extrapolate some bigger trends at work. The daily and weekly trend indicators are bullish for both SPY and QQQ... Read More
Art's Charts December 22, 2015 at 09:07 AM
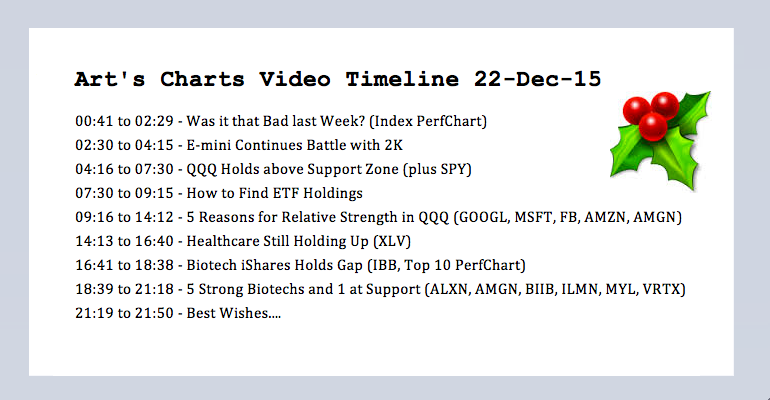
Was it that Bad last Week? // E-mini Continues Battle with 2K // QQQ Holds above Support Zone // Five Reasons for Relative Strength in QQQ // Healthcare Still Holding Up // Biotech iShares Holds Gap // Five Strong Biotechs and One at Support // Best Wishes...... Read More
Art's Charts December 18, 2015 at 12:23 PM
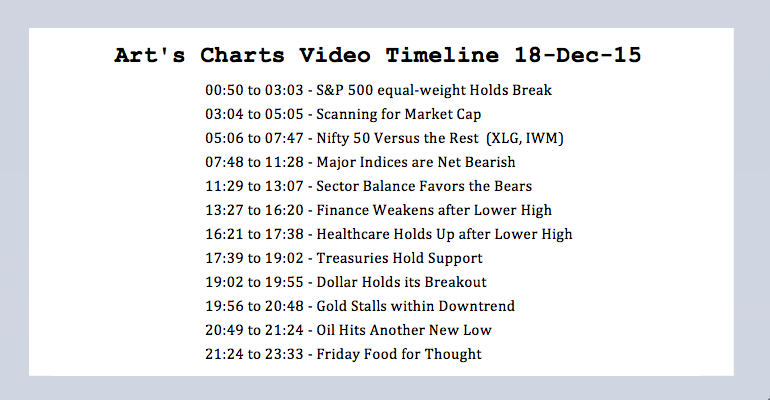
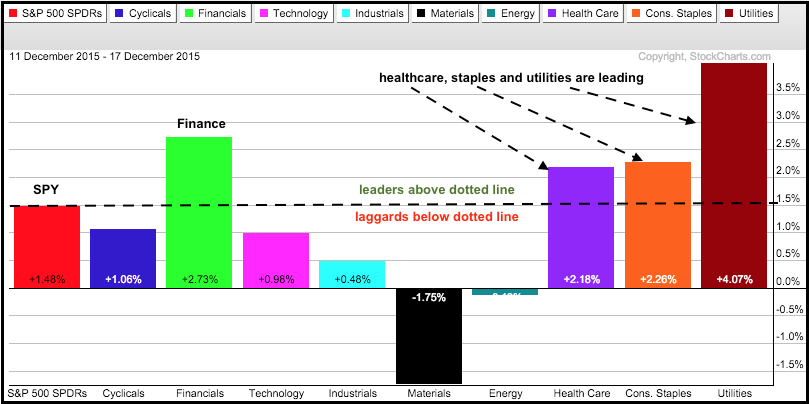
S&P 500 equal-weight Holds Break // Nifty 50 Versus the Rest // Major Indices are Net Bearish // Sector Balance Favors the Bears // Finance Weakens after Lower High // Healthcare Holds Up after Lower High // Treasuries Hold Support and Uptrend // Dollar Holds its Breakout // Gold... Read More
Art's Charts December 18, 2015 at 03:15 AM
Monday we saw a perfect storm come together for a short-term bounce. The S&P 500 was short-term oversold after a sharp decline, the index was near support from the mid November low and the seasonal patterns turned bullish on the 10th trading day of December... Read More
Art's Charts December 16, 2015 at 05:55 PM
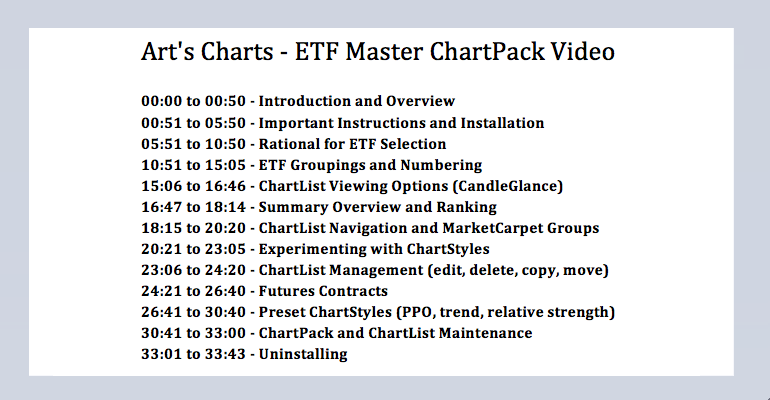
Introduction and Overview // Important Instructions and Installation // Focus, Diversity and Passivity // ETF Sponsors // ETF Groupings and Numbering // ChartList Viewing Options (Summary, Candles, Carpets) // ChartStyles and Indicators // Final Thoughts and Installation Link // ... Read More
Art's Charts December 15, 2015 at 08:57 AM
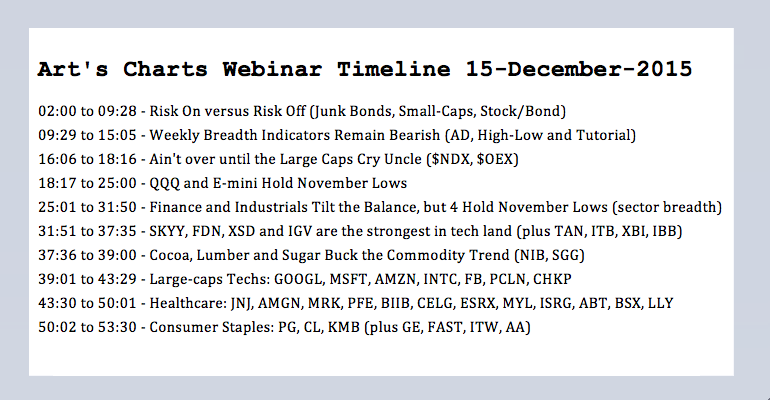
E-mini Tests 2000 Again // QQQ Holding above November Low // Small, Mids and Equals Extend Suffering // Weekly Breadth Indicators Remain Bearish // Finance and Industrials Tilt the Balance // Webinar Topics //// Pockets of Strength? The evidence for the broad stock market turned ... Read More
Art's Charts December 14, 2015 at 04:22 AM
Finance Weighs with Sharp Decline // SPY and QQQ Trend Filters Still Bullish // Seasonal Patterns Point to Bottom This Week // Mind the Gap and Short-term Downtrend //// Finance Weighs with Sharp Decline There were some medium-term and long-term bearish developments last week, bu... Read More
Art's Charts December 12, 2015 at 08:52 AM
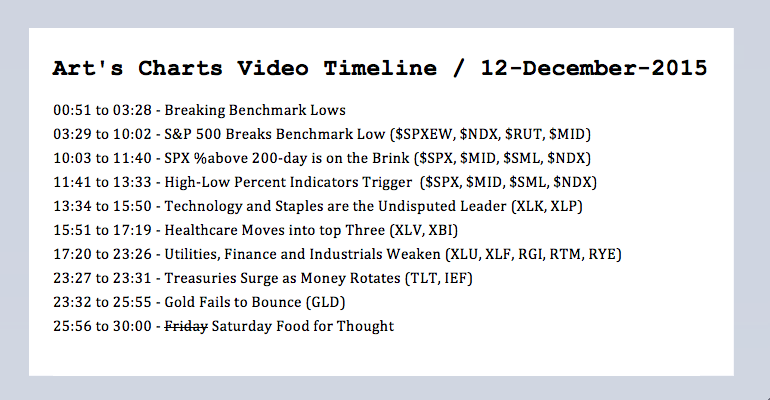
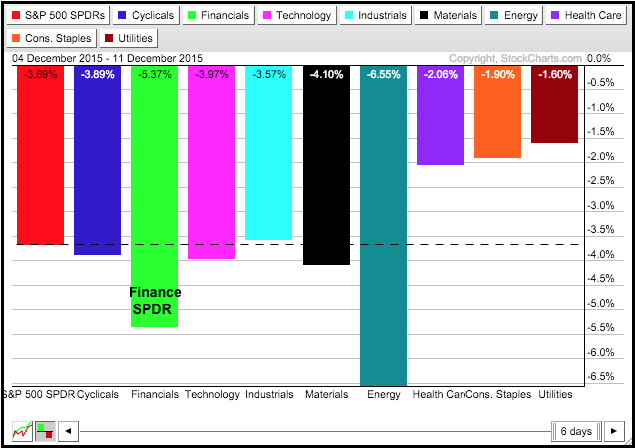
S&P 500 Breaks Benchmark Low // SPX %Above 200-day Is on the Brink // High-Low Percent Indicators Trigger // Technology is Undisputed Leader // Healthcare Moves into top Three // EW Consumer Discretionary Breaks Down // Treasuries Surge as Money Rotates // Gold Fails to Bounce //... Read More
Art's Charts December 10, 2015 at 09:00 AM
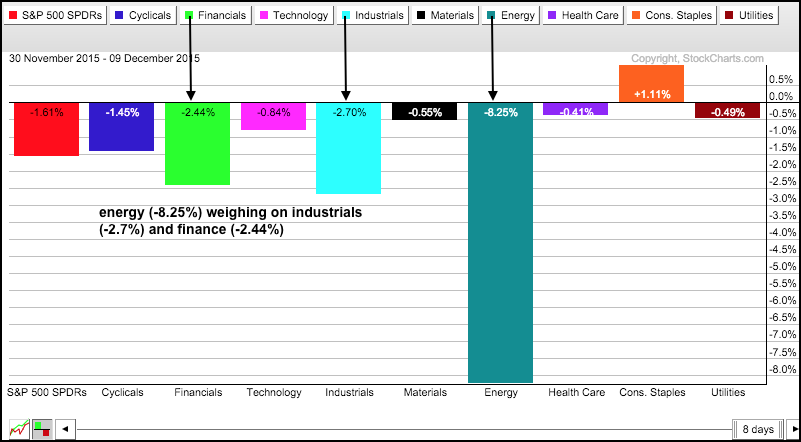
Energy Weighs on Two Key Sectors // SPY Puts the PPO to the Test // IWM Hits Moment-of-truth // Relative weakness in Small and Mid Caps Persists // XLF and RYF Tests November Lows // Regional Bank SPDR Breaks Support // XLI and RGI Exceed November Lows // Four Inside Days for IBB... Read More
Art's Charts December 08, 2015 at 09:25 AM
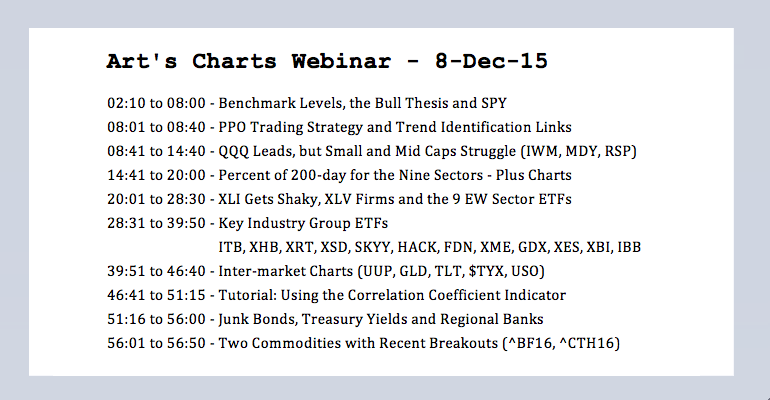
The One Key Level // SPY Uptrend with Triangle // IWM Struggling, but above Key Support // Junk Bonds, Treasury Yields and Regional Banks // Percent of 200-day for the Nine Sectors // Webinar Preview //// The One Key Level Stocks are under pressure before the open and oil is gett... Read More
Art's Charts December 04, 2015 at 09:27 AM
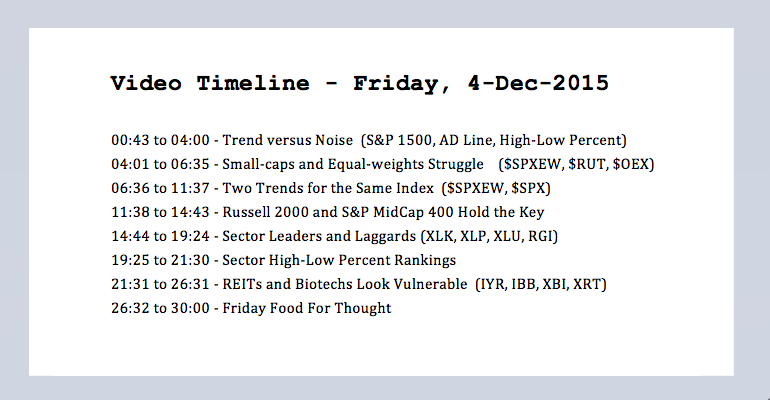
Click here for today's video // Trend versus Noise // Small-caps and Equal-weights Struggle // Two Different Trends for the Same Index // Russell 2000 and S&P MidCap 400 Hold the Key // Sector Leaders and Laggards // Sector High-Low Percent Rankings // REITs and Biotechs Look Vul... Read More
Art's Charts December 03, 2015 at 08:44 AM
SPY Holds Short-term Breakout // IWM Shows Relative Chart Strength // 2-yr Yield versus the 10-yr Yield // Watching the Channel in IEF // Two Commodities in Uptrends // Legacy Airlines Sport Constructive Chart Patterns // Big Banks Consolidate after Surge // Short-term Bearish Pa... Read More
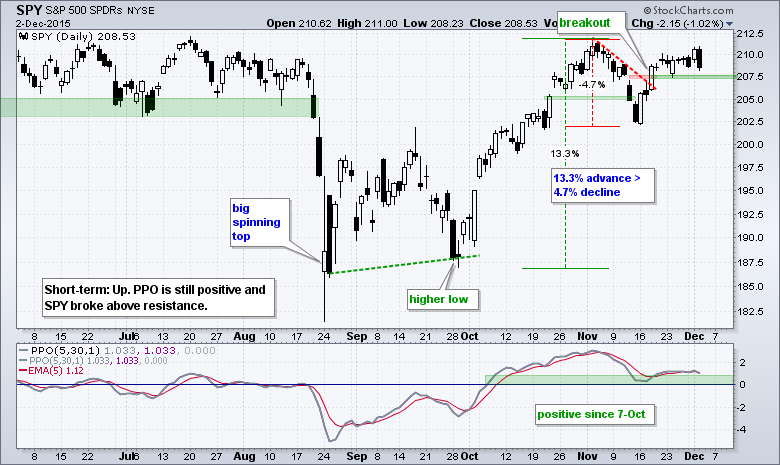
Art's Charts December 01, 2015 at 08:45 AM
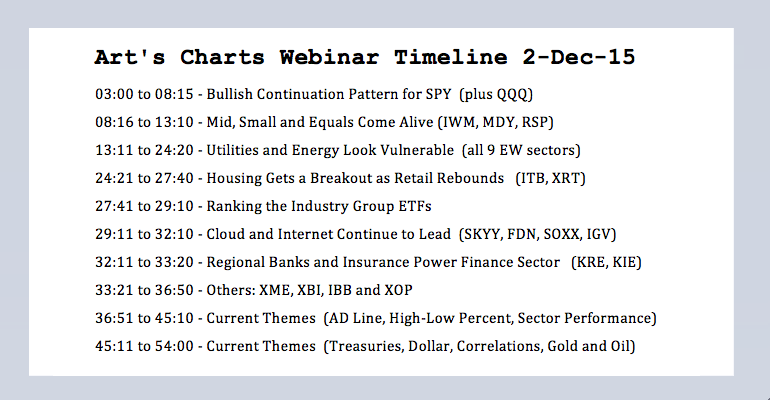
Small and Mid Caps Come Alive // Bullish Continuation Pattern for SPY // Utilities and Energy Look Vulnerable // Housing Gets a Breakout as Retail Rebounds // Cloud and Internet Continue to Lead // Regional Banks and Insurance Power Finance Sector // Current Market Themes //// Ma... Read More