Art's Charts February 29, 2016 at 06:44 AM
Breadth Thrust Falls Short // Setting a Potential Reversal Zone // 3 Keys to Short-term Uptrend // Bearish PPO Setups // Confirming the Short-term Trend with Breadth // XLK and XLY Tests Falling 200-day // XLE Remains the Weakest // XLP Forms Outside Reversal //// Breadth Thrust ... Read More
Art's Charts February 26, 2016 at 12:14 PM
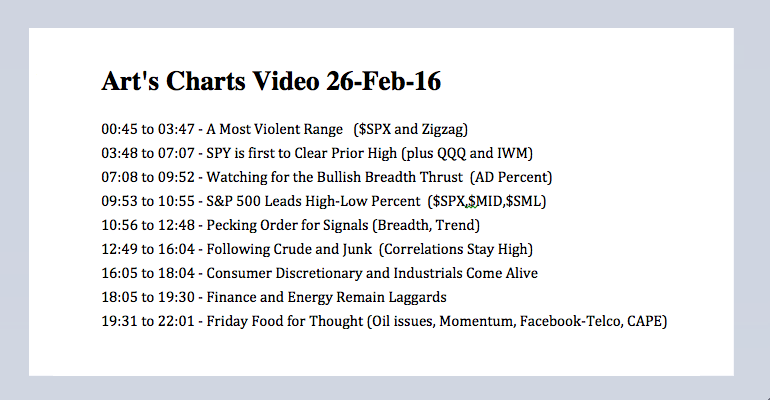
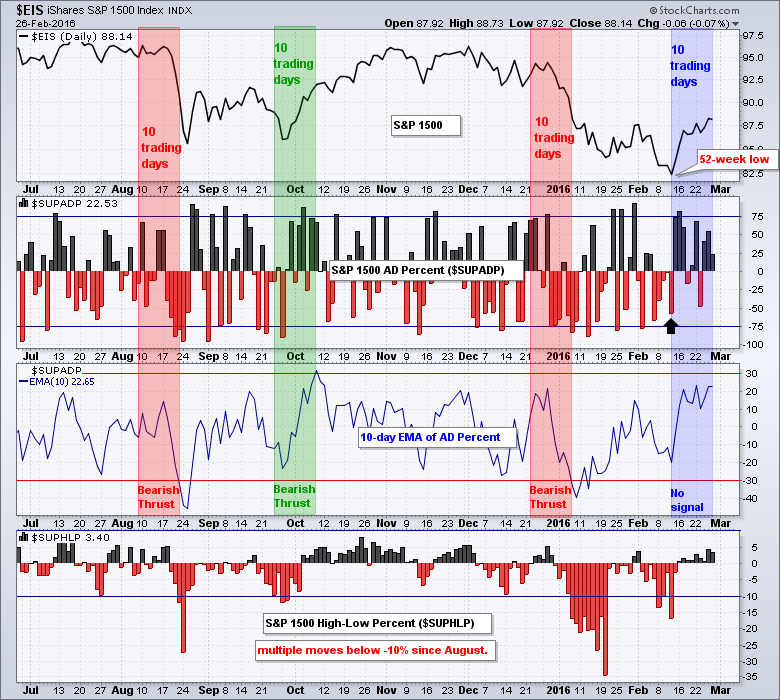
A Most Violent Range // SPY is first to Clear Prior High // Watching for the Bullish Breadth Thrust // S&P 500 Leads High-Low Percent // Signal Pecking Order // Following Crude and Junk // Consumer Discretionary and Industrials Come Alive // Finance and Energy Remain Laggards // ... Read More
Art's Charts February 25, 2016 at 09:24 AM
Setting Short-term Support for the big 3 // Short-term Breadth Remains Bullish // Next Two Days Could Hold the Key for Breadth // Equal-weight, Small-caps and Mid-caps Take the Lead // Consumer Discretionary and Retail Outperform // Junk Bonds Get a Bounce // Bonds, Gold and the ... Read More
Art's Charts February 23, 2016 at 10:42 AM
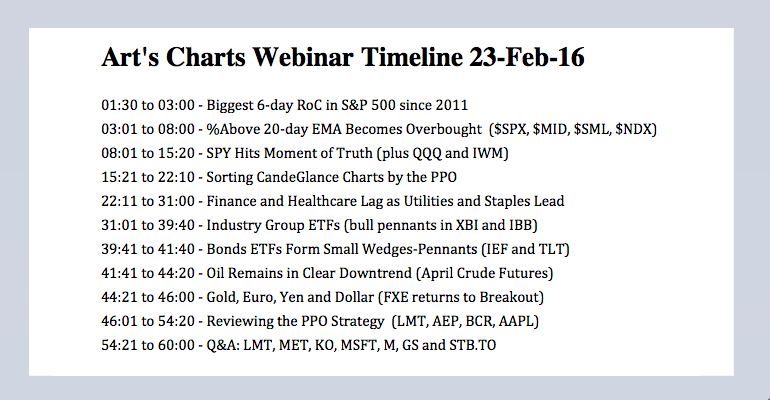
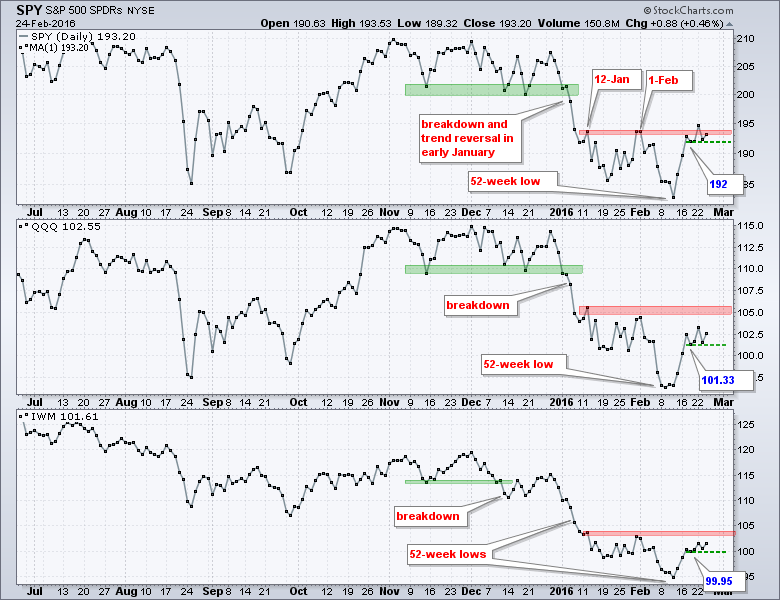
SPY Hits Moment of Truth // %Above 20-day EMA Becomes Overbought // Oil is Still in a Downtrend // Reviewing the PPO Strategy // Reconciling the PPO with the Price Chart // Webinar Preview SPY Hits Moment of Truth It was another day and another gap as SPY closed at its highest le... Read More
Art's Charts February 22, 2016 at 06:14 AM
Breadth Surge Falls Short of Bullish Signal // Another Gap to Mind // Stocks of Interest (CHKP, FB, SYK, UNH) //// The long-term evidence remains bearish, but the short-term evidence turned bullish with the reversals and gaps in mid February... Read More
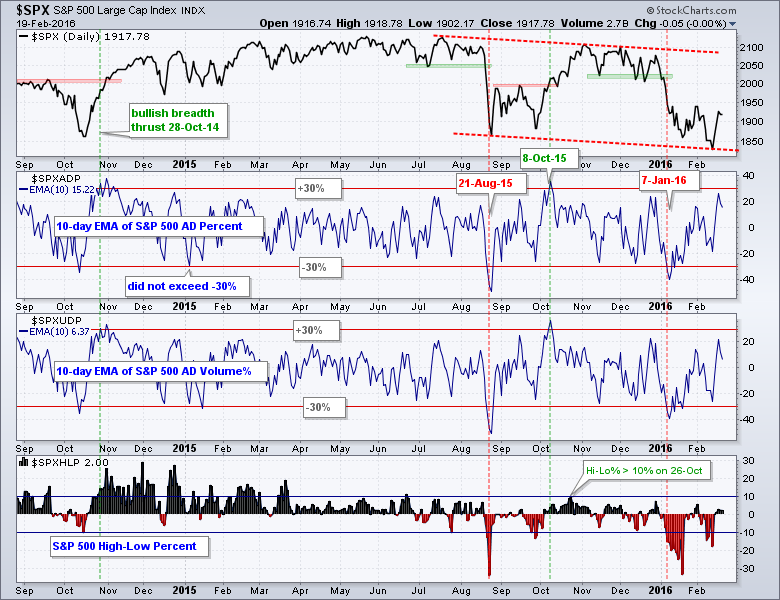
Art's Charts February 19, 2016 at 11:34 AM
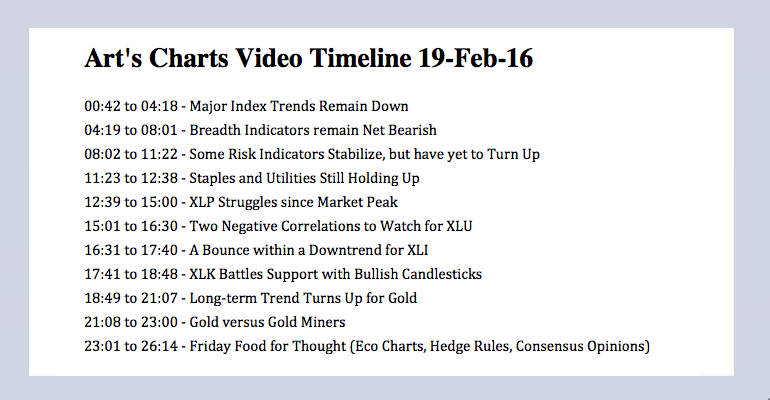
Three Prong Approach // Major Index Trends Remain Down // Breadth Indicators remain Net Bearish // Some Risk Indicators Stabilize, but have yet to Turn Up // Staples and Utilities Still Holding Up // XLP Struggles since Market Peak // XLU Benefits from Two Negative Correlations /... Read More
Art's Charts February 18, 2016 at 09:08 AM
Putting the 3-day Surge into Perspective // The Concept of the Zweig Breadth Thrust // Don’t forget Nasdaq Stocks // A Weight of the Evidence Approach to Breadth Thrusts // Measuring Money Flow Thrusts with AD Volume Percent // Final Confirmation with High-Low Percent // The Bott... Read More
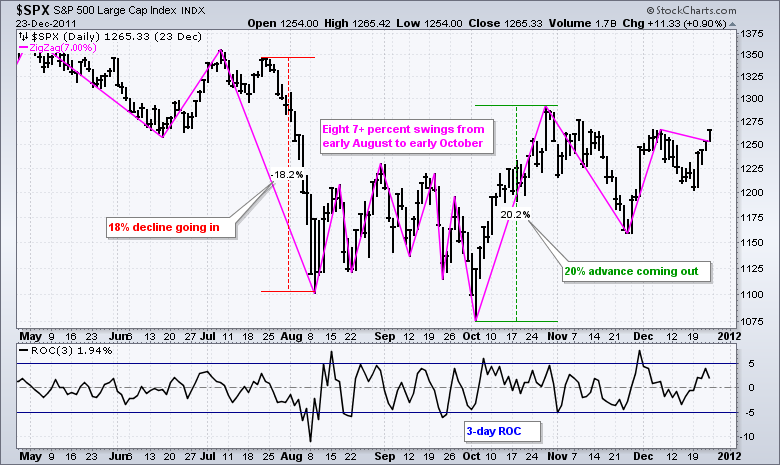
Art's Charts February 17, 2016 at 09:17 AM
SPY Heads for First Retracement // A Look at the 2011 Double Bottom Bounce // QQQ Forges an Island Reversal // Energy, Materials and Industrials Lead Short-term Bounce // Charting the Key Stocks in XLE, XLB and XLI // XOM, CVX, SLB, DD, DOW, MON, GE, HON, MMM //// Mind the Gaps S... Read More
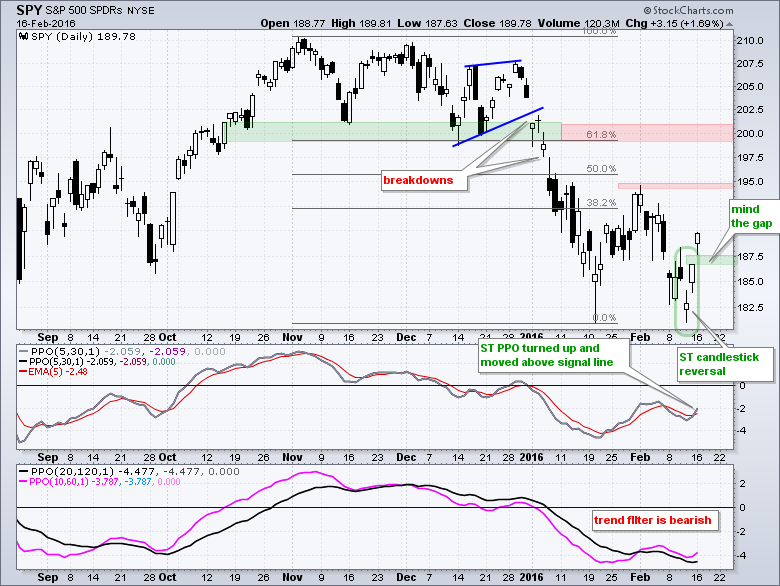
Art's Charts February 16, 2016 at 09:27 AM
Keep the Long-term Trends in Mind // A Candlestick Reversal for SPY // XLP Triggers Bullish PPO Signal // Brent versus WTI // Webinar Preview //// Keep the Long-term Trends in Mind The long-term trends are down for SPY, QQQ and IWM, but a short-term reversal pattern last week and... Read More
Art's Charts February 12, 2016 at 09:31 AM
52-week Lows Reinforce Downtrends // Downtrends in Five Key Asian Markets // Italy and Spain Lead Europe to New Lows // Lower Lows all Around in the US // Using the %Above 50-day EMA to Gauge Participation // Using the %Above 50-day EMA to Rank Performance // Friday Food for Thou... Read More
Art's Charts February 11, 2016 at 09:24 AM
Trend Trumps All Else // Forget about Support Levels in a Downtrend // Oversold Can Become Even More Oversold // Elevator Down Stairs Higher // Few Places to Hide // Correlations Rise in a Bear Market // Cash is a Real Position // A Penny Saved is Worth more Than a Penny Earned /... Read More
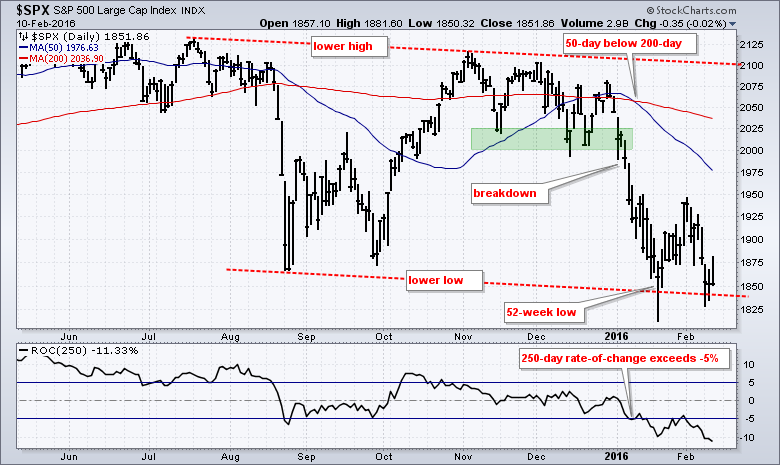
Art's Charts February 10, 2016 at 08:54 AM
Before looking at the short-term situation for SPY, QQQ and IWM, let's review the bigger trends using the S&P 500 and Russell 2000. Some things are open for debate in the stock market, but I don't think there is much debate on the long-term trends. They are down by most metrics... Read More
Art's Charts February 09, 2016 at 09:38 AM
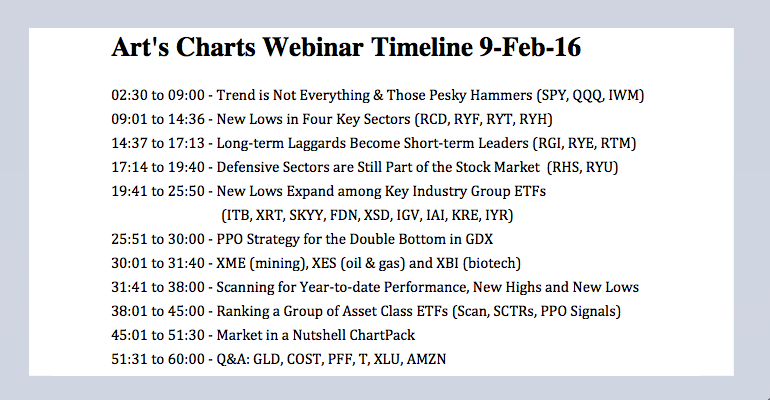
Trend is Not Everything, it's... // Those Pesky Hammers // New Lows in Key Sectors // Even Healthcare is not Healthy // Long-term Laggards Become Short-term Leaders // Staples Start Feeling the Heat //// Trend is Not Everything, it's..... Read More
Art's Charts February 05, 2016 at 12:08 PM
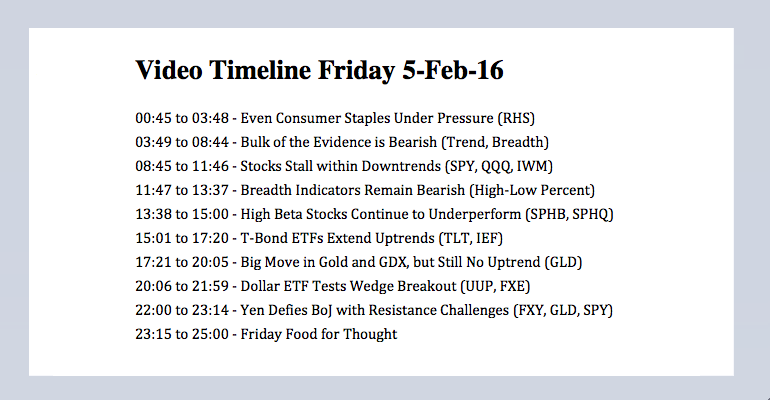
Even Consumer Staples are Under Pressure // Bulk of the Evidence is Bearish // Stocks Stall within Downtrends // Breadth Indicators Remain Bearish // High Beta Stocks Continue to Underperform // T-Bond ETFs Extend Uptrends // Big Move in Gold and GDX, but Still No Uptrend // Doll... Read More
Art's Charts February 04, 2016 at 08:54 AM
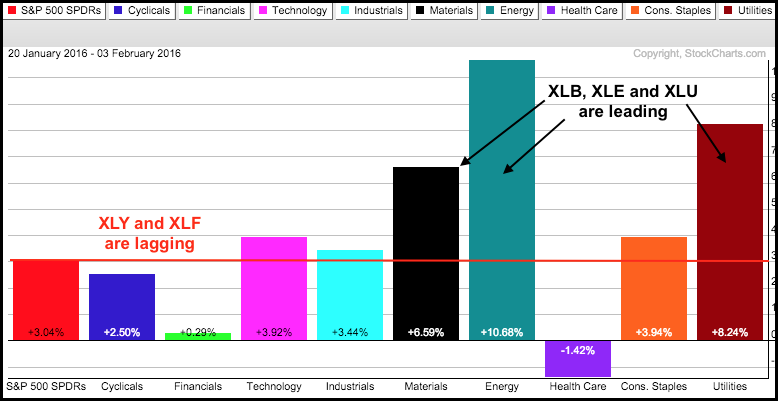
Wrong Sectors Leading // Key Industry Groups Lagging // Is the FORCE Bullish or Bearish? // Testing Wedge Support (SPY, QQQ, IWM) // Overview of the Nine Sector SPDRs // Oversold Bounces for Housing and Semis // Showing Patience with the Gold Miners ETF (and gold) //// Wrong Sect... Read More
Art's Charts February 02, 2016 at 09:37 AM
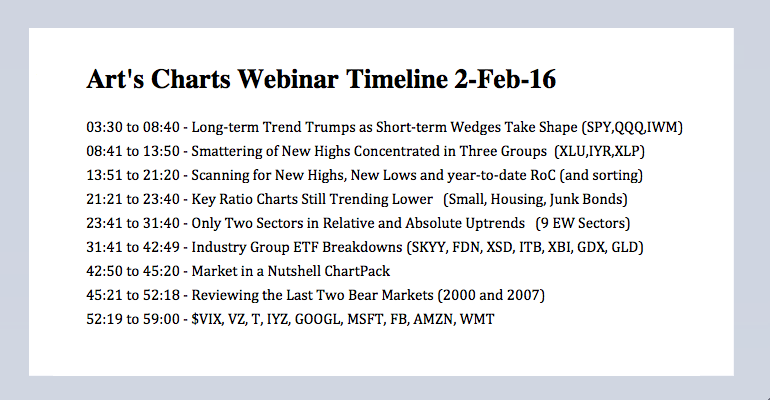
Long-term Trend Trumps // Short-term Wedges Taking Shape // Key Ratio Charts Still Trending Lower // Smattering of New Highs // New Highs Concentrated in Three Groups // Relative and Absolute Uptrends // Webinar Highlights //// Long-term Trend Trumps Stocks firmed in mid January ... Read More