Large-caps Still Leading, but Small-caps Perk Up // Mind the Gaps in SPY and IWM // Sector Rotation is Bullish for Broader Market // XLI, XLK and XLY Near 52-week Highs // XLY, XLI and XLK Hold Consolidation Breakouts // Utilities and Staples Suffer as Bond Surrogates // Short-term Leaders Remain Strong // Yield Surge is Bullish for Stocks ////
Large-Caps Still Leading, but Small-caps Perk Up
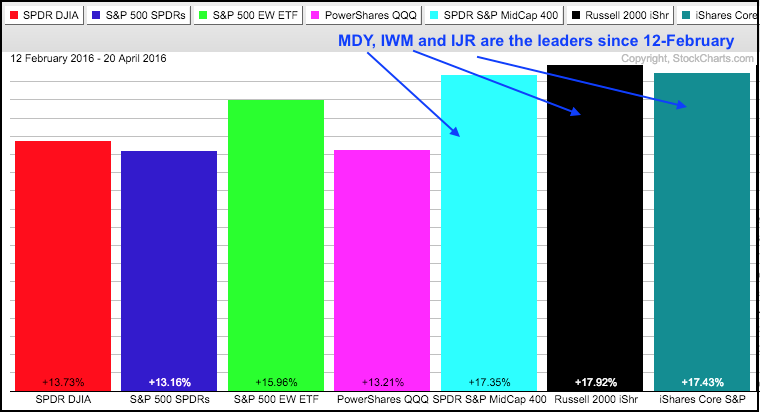
There is no real change for the major index ETFs (SPY, QQQ and IWM). The trends have been up since early March and all three recorded new highs for the move. There were price breakouts in late February, breadth surges in early March and new high expansions in late March. This is bull market stuff. SPY, DIA and OEF hit new all time highs this week and large-caps are the chart leaders. Note, however, that the EW S&P 500 ETF (RSP) is within 2% of its all time high and the S&P SmallCap iShares (IJR) is within 5%. Even though the Russell 2000 iShares is 12% below its high and lagging based on the chart, it is the ETF with the biggest gain since the bottom in mid February (+17.92%). Also notice that the EW S&P 500 ETF (RSP) is outperforming SPY. Stocks are indeed ripe for a small correction, but that does not guarantee one. The trend is up and this is the dominant force right now.
Mind the Gaps in SPY and IWM
On the SPY chart, I adjusted the Raff Regression Channel to extend from the late February low to the current high. The lower line, late March low, early April low and a buffer mark support in the 200-204 area. Why such a big zone? Because SPY has 500 stocks pushing and pulling it different directions. I don't want to get cute and mark support at 203.9 (7-Apr low) because I think we are in a bull market environment. This means pullbacks are viewed as opportunities, not threats. A pullback into this zone, therefore, would be considered a potential buying opportunity. Chartists looking for an early bird sign of weakness can watch the 13-Apr gap. A close below this level would negate the pennant breakout in SPY.

QQQ struggled over the last five days, but the flag breakout and gap are holding. A close below 109.5 would fill this gap and negate the flag breakout. Even though this would be a sign of weakness, I would not call for a bigger trend reversal just yet. The Raff Regression Channel and recent troughs mark support in the 106.5-108 area.

IWM shows some leadership since mid February as the price relative (IWM:SPY ratio) bottom and formed a higher low in late March. A break above the early March high would signal an uptrend in the price relative and a return to relative strength in small-caps.

Sector Rotation is Bullish for Broader Market
As noted in Wednesday's Don’t Ignore this Chart, we saw a dramatic shift in sector leadership in April. This shift is just as dramatic when we compare the first 30 days of the year with the last 48 days. As you may have guessed, February 11-12 marks the dividing line when the market moved from risk-off to risk-on in a big way. Notice that eight of the nine sectors were down in this first period with consumer discretionary, finance and healthcare leading the way. Consumer staples showed the smallest loss and utilities showed the only gain.


The next PerfChart shows the percentage change since February 11th. Cyclicals (XLY), financials (XLF), materials (XLB) and energy (XLE) are leading the market with the biggest gains. It is extremely positive to see XLF and XLY showing some upside leadership. Also notice that the defensive sectors are lagging because they show the smallest gains. Overall, this shows a clear preference for the riskier side of the market and this is positive for stocks.
XLI, XLK and XLY Near 52-week Highs
There are, of course, several ways to measure relative performance. One's take on relative performance is also contingent on the timeframe and the indicator. My personal preference is "chart" strength and I measure this using the distance from its high. Sectors at or near a new high show more "chart" strength than sectors further from a new high. Right now, XLI, XLK and XLY are the closest to their 52-week highs (less than 2%). XLU and XLP are next (2-4% from a 52-week high). XLF, XLV, XLB and XLE are bringing up the rear (7-22% from a 52-week high). The charts show the nine sector SPDRs in this order and there are annotations for support. I am not marking resistance because the trend is up and resistance levels are inconsistent with the concept of an uptrend. Support levels, on the other hand, are important and should be monitored.

XLY, XLI and XLK Hold Consolidation Breakouts
The first three charts show XLY, XLI and XLK with consolidation breakouts and gap. These are holding and bullish until proven otherwise (filling of the gap).


Utilities and Staples Suffer as Bond Surrogates
XLP and XLU were hit hard on Wednesday as the 10-YR Treasury Yield ($TNX) surged above 1.85%. I will have more on bonds after the sectors. XLU and XLP are kind of like safe-haven bond surrogates and they benefit from a falling rate environment, especially XLU. The surge in yields and plunge in bonds showed money moving out of safe-havens and this is negative for staples and utilities. Even though XLU and XLP are still close to their 52-week highs, they are moving away from these highs and showing relative weakness the last few months.


Short-term Leaders Remain Strong
The next four sectors are the recent leaders because they show the biggest gains in April. They are still lagging on a long-term basis, but they are all in uptrends with three of the four sporting flag/wedge breakouts recently.


Yield Surge is Bullish for Stocks
The 7-10 YR T-Bond ETF (IEF) continues to underperform the S&P 500 SPDR and a double top could be taking shape. Relative weakness in IEF is positive for stocks because it means money prefers risk over safety. The indicator window shows the price relative (IEF:SPY ratio) with three periods. Stocks advanced when IEF underperformed SPY until July-August 2015. Stocks fell on hard times when IEF outperformed until February 2016. Stocks have moved higher since IEF underperformed from February to now.

It is also possible that a double top is taking shape on the price chart. I hate to even mention a double top because I am a trend follower by nature and usually get in trouble when I try to pick tops or bottoms! The March low marks double top support and a break here would be bearish for Treasuries.
The next chart shows the 10-YR Treasury Yield ($TNX) bouncing off the 16-17 area (1.6-1.7 percent) with a big surge this week. The indicator window shows a pretty strong positive correlation between the 10-yr yield and the S&P 500. An upturn in rates, therefore, would be positive for stocks.

**************************************
Measuring Risk On-Risk Off - Using charts to quantify stock, economic and credit risk.
PPO Trading Strategy - How to use 3 PPOs to develop a trend-reversion trading strategy.
Long-term Trend Indicators - Using the PPO, EMA Slope and CCI to determine the trend.
ETF Master ChartPack - 300+ ETFs organized in a Master ChartList and in individual groups.
Follow me on Twitter @arthurhill - Keep up with my 140 character commentaries.
****************************************
Thanks for tuning in and have a good day!
--Arthur Hill CMT
Plan your Trade and Trade your Plan
*****************************************
