New Highs for SPY and DIA // Uptrends Extend for SPY, QQQ and IWM // New Highs in Several AD Lines // Risk Indicators Turn Up Again // Five Clear Sector Leaders // Three of Five FAAAM Stocks Strong // Webinar Highlights ////
New Highs for SPY and DIA
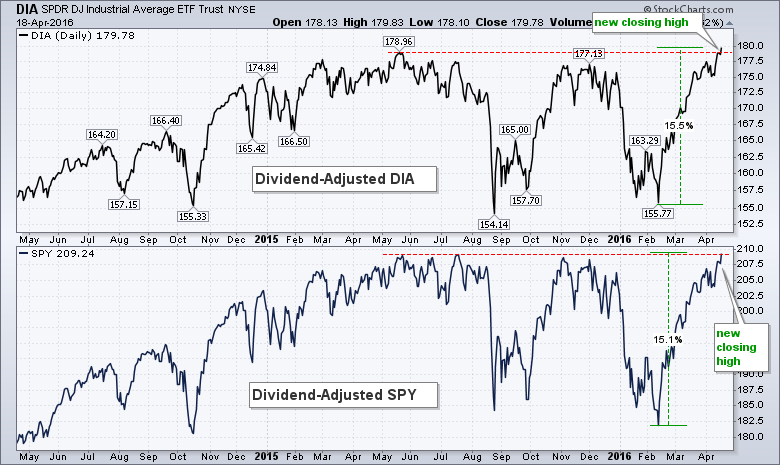
The weight of the evidence remains bullish for stocks. On a closing basis, the dividend-adjusted S&P 500 SPDR and Dow Diamonds finished at new all time highs. The S&P 500 and Dow Industrials, which do not include dividend adjustments, are around 2% from an all time high.
Small-caps are still lagging over the last six months, but note that the Russell 2000 is leading in April (13 trading days). The PerfChart below shows the percentage change for seven major indices and $RUT sports the biggest gain (+2.27%). The market took on a little more risk in April and this is positive overall.

Uptrends Extend for SPY, QQQ and IWM
The uptrends extended as SPY, QQQ and IWM notched new closing highs for the current move, which began with the mid February reversals. All three gapped up last Wednesday and these gaps have held for four days now. In fact, last week's gaps triggered flag/wedge breakouts in all three. The gaps mark the first levels to watch for signs of short-term selling pressure. A close below 109 in QQQ, 110 in IWM and 205.90 in SPY would fill these gaps and negate last week's breakouts. This, however, would not be enough to affect the medium-term uptrend. With new highs for the move, I extended the Raff Regression Channels to yesterday's closing high and raised key support a tad.

The indicator windows show Aroon Up (green) and Aroon Down (red). There are several ways to generate signals: a simple cross, a cross and confirming move above 50 or a surge to 100. The most unequivocal signal is the surge to 100. The trend is up when Aroon Up hits 100 and remains up until Aroon Down counters with a move to 100. On the SPY chart, notice that Aroon Up surged to 100 on 22-Feb and hit 100 again on Monday. You can read more about the Aroon indicators in our ChartSchool.


New Highs in Several AD Lines
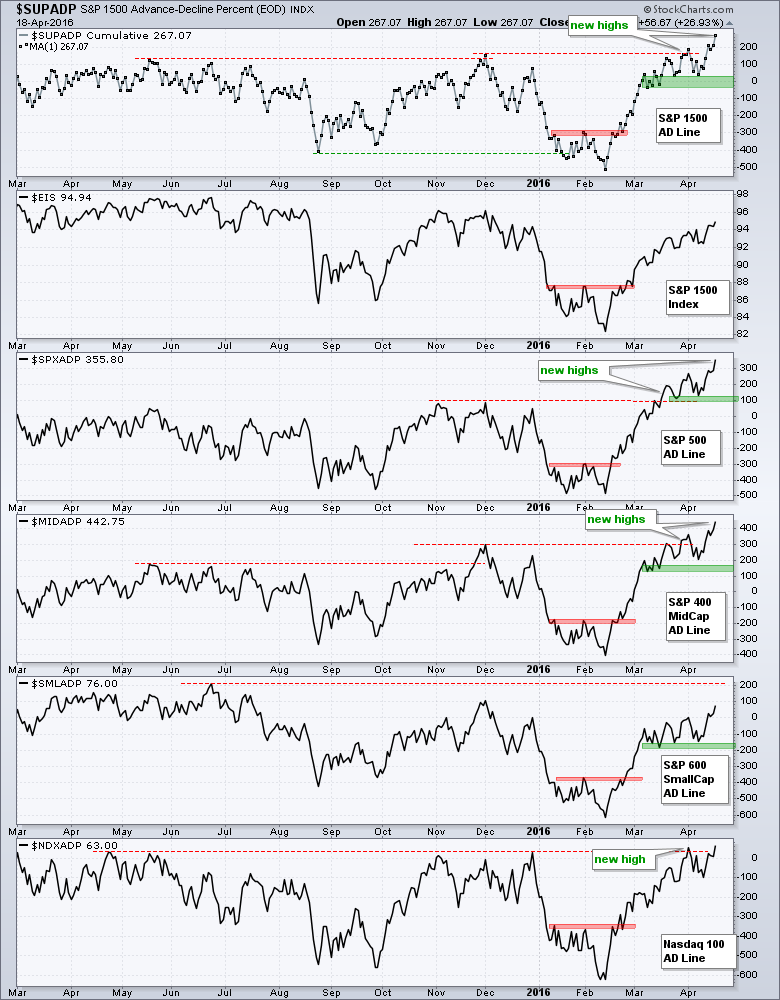
The breadth behind this advance remains strong because the AD Lines for the S&P 1500, S&P 500, S&P MidCap 400 and Nasdaq 100 hit new highs recently. This means they exceeded their 2015 highs and the advance is quite broad. The S&P Small-Cap 600 AD Line has yet to hit a new high and remains the laggard the group, but it is in an uptrend over the last two months and closing in on its November high. I am not concerned with the "non-confirmation by the S&P Small-Cap 600 AD Line because I use a weight of the evidence approach when it comes to the stock market. I am more impressed with the new highs in the other four AD Lines (4 > 1).
Risk Indicators Turn Up Again
I use a number of ratio charts to measure the appetite for risk in the stock market. The riskier asset is the numerator and the safer asset is the denominator. For example, the SPY:IEF ratio shows the performance of the S&P 500 SPDR (riskier asset) to the 7-10 YR T-Bond ETF (safer asset). There are eight ratios on the chart below and only two reflect risk aversion. Again, I am using a weight of the evidence approach when looking at these risk indicators. The first three ratios fell from March to early April, but turned up last week as the appetite for risk improved. Notice that the S&P 500 High Beta ETF (SPHB) is outperforming the S&P 500 High Quality ETF (SPHQ) again, the EW S&P 500 ETF (RSP) is perking up relative to the S&P 500 SPDR (SPY) and Russell 2000 iShares (IWM) started outperforming the Russell Top 50 ETF (XLG) in April. And perhaps most important, stocks (SPY) are outperforming bonds (IEF) as the SPY:IEF ratio hit a new high for the move.

On the weak side, the EW Consumer Discretionary ETF (RCD) and the Retail SPDR (XRT) show relative weakness and continue to underperform overall. This is negative, but these two negatives are outnumbered by the positives and the weight of the evidence suggests risk-on right now. Note that the Home Construction iShares (ITB) is outperforming and the Transportation SPDR (XTN) is performing in line.
Five Clear Sector Leaders
Even though relative performance differs among the sector SPDRs, all nine are in uptrends and all nine are above their 200-day moving average. The Finance SPDR (XLF) was the last to clear its 200-day SMA with a close above this key level on Monday. The Energy SPDR (XLE) cleared its 200-day SMA last week and the HealthCare SPDR (XLV) moved back above its 200-day SMA last week. These three are the "least" strong of the nine sectors because they were the last to break their 200-day SMAs.

All nine sector SPDRs are above their 50-day SMAs. The broader market is clearly in good shape as long as all nine remain above this level. While I do not consider the 50-day SMA a "support" level, it is common level we can use to compare sector performance. I would not become concerned with the broader market until some of the big sectors move below their 50-day SMAs. Also note that the 50-day SMA is above the 200-day SMA for five of the nine sector SPDRs (XLK, XLI, XLB, XLP, XLU). These are the five leaders right now. The thin blue lines mark small consolidation patterns in several SPDRs. The recent breakouts are bullish and they are holding.

Three of Five FAAAM Stocks Strong
The next chart shows the five most important technology/consumer stocks (IMHO) and the S&P 500 SPDR (SPY) for reference. I am using the acronym FAAAM (pronounced fame with a loooonggg a). Alphabet, Amazon and Microsoft are strong, very strong. AMZN broke out in late March and surged the last four weeks. GOOGL and MSFT broke out last week and the latter hit a new high. Overall, four of the five are above their 50-day SMAs and 200-day SMAs. This bodes well for QQQ and the technology sector.

Facebook is in an uptrend overall, but the stock fell back over the last three weeks with a falling flag. This, however, is a bullish continuation pattern and a breakout at 113 would reverse the slide. Apple had a strong move from mid February to mid April and then fell back sharply over the last two days. Notice that Apple turned back at its 200-day moving average and is the only one of the four below this key level.
*********************************************
Measuring Risk On-Risk Off - Using charts to quantify stock, economic and credit risk.
PPO Trading Strategy - How to use 3 PPOs to develop a trend-reversion trading strategy.
Long-term Trend Indicators - Using the PPO, EMA Slope and CCI to determine the trend.
ETF Master ChartPack - 300+ ETFs organized in a Master ChartList and in individual groups.
Follow me on Twitter @arthurhill - Keep up with my 140 character commentaries.
****************************************
Thanks for tuning in and have a good day!
--Arthur Hill CMT
Plan your Trade and Trade your Plan
*****************************************
