Art's Charts March 31, 2017 at 08:56 AM

.... Is One Week of Risk-On Enough? .... Breadth Underwhelms on latest Surge .... SPY Remains in Corrective Mode .... IJR Gets a Mini-Breakout within a Consolidation .... Another New High for QQQ, but.., .... Five Sectors Still Holding Up ...... Read More
Art's Charts March 30, 2017 at 10:28 AM

..... A Bollinger Band Squeeze System .... Trend Filters and Trading Signals .... JPM with a Winner and a Loser .... XOM with Two Losing Trades .... System Ground Rules .... Backtest Results for S&P 1500 .... Conclusions - Caveat Emptor! ...... Read More
Art's Charts March 28, 2017 at 08:23 AM
.... SPY Remains the Key Yardstick .... Using the 50-day SMA to Compare Charts .... IJR Attempts another Oversold Bounce .... Banking Stocks Hit Support Zones (BAC, C, JPM, WFC, STT) .... Watch TLT and $TNX for Clues on XLF ...... Read More
Art's Charts March 25, 2017 at 06:38 AM
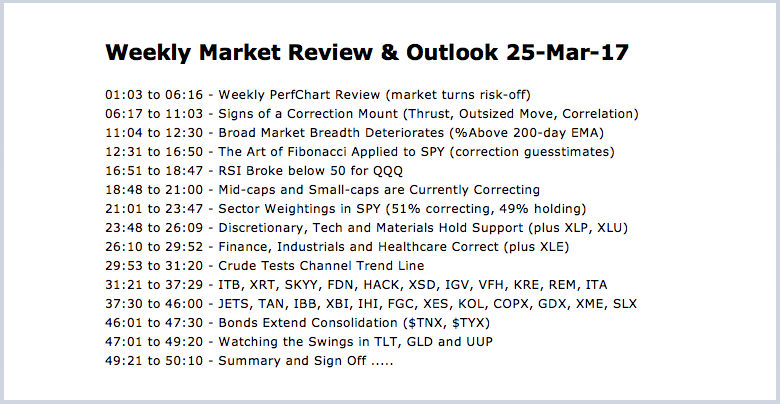
----- Video Link ----- Art's Charts ChartList (updated 25-Mar) ----- Note that the Art's Charts ChartList has been updated with 30 annotated charts covering the industry group ETFs. The outline above is for the video and I cover these industry group ETFs in the video... Read More
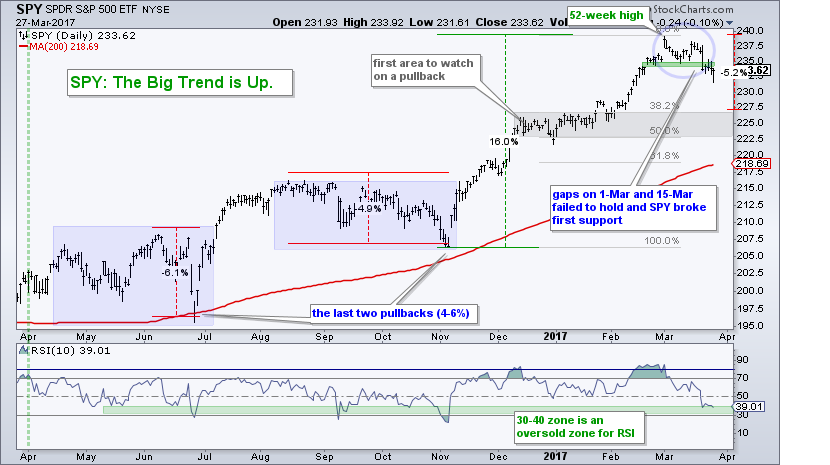
Art's Charts March 24, 2017 at 12:25 PM

.... Signs of a Correction Mount .... Broad Market Breadth Deteriorates .... The Art of Fibonacci Applied to SPY .... RSI Breaks below 50 for QQQ .... Mid-caps and Small-caps are Currently Correcting .... Discretionary, Tech and Materials Hold Support ...... Read More
Art's Charts March 23, 2017 at 03:24 PM
.... Filtering out PPO Signals .... MACD versus the Percentage Price Oscillator .... Testing Signal Line Crossovers .... Adding Some Filters to the PPO Signals .... Adding Focus to the Portfolio .... Conclusions - Caveat Emptor! ...... Read More
Art's Charts March 22, 2017 at 07:11 AM

.... Breadth Indicators Plunge to Extremes .... Finance, Industrials and Tech Get Hit Hard .... SPY has not Done This since October .... Small-cap Correlation Turns Down .... RSI Breaks Key Level for QQQ .... The Bottom Line .... What a difference a day makes - 24 little hours... Read More
Art's Charts March 21, 2017 at 09:01 AM
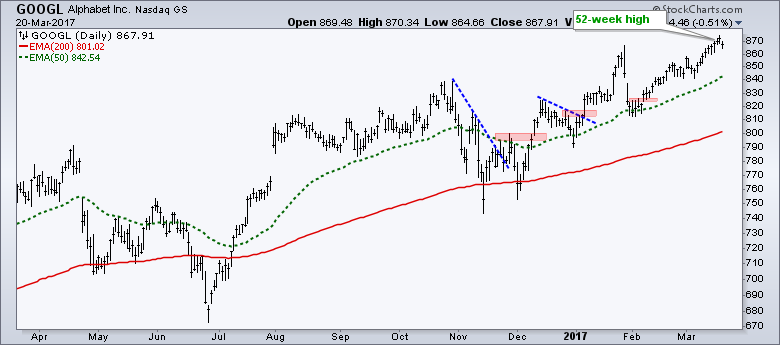
.... The Fab Five Remain Strong (GOOGL, AAPL, FB, MSFT, AMZN) .... Equinix Looks Set to Continue Uptrend .... Think Market, Sector, Group and Trend First (NVDA) .... A Payment Processor, A Big Data Player and an IoT Leader (PYPL, TDC, XLNX) ...... Read More
Art's Charts March 18, 2017 at 09:56 AM
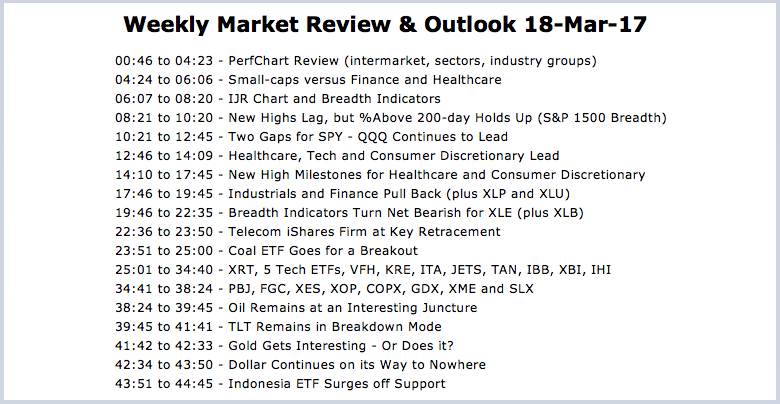
The stock market moved higher again this past week with several sector and industry group ETFs hitting new highs. Four of the five sector SPDRs hit fresh 52-week highs. These include the Technology SPDR, HealthCare SPDR, Consumer Staples SPDR and Consumer Discretionary SPDR... Read More
Art's Charts March 17, 2017 at 12:57 PM
.... Small-caps versus Finance and Healthcare .... New Highs Lag, but %Above 200-day Holds Up .... Two Gaps Establish First Support for SPY .... QQQ Continues to Lead and IJR Continues to Lag .... Healthcare, Tech and Consumer Discretionary Lead ...... Read More
Art's Charts March 16, 2017 at 08:54 AM
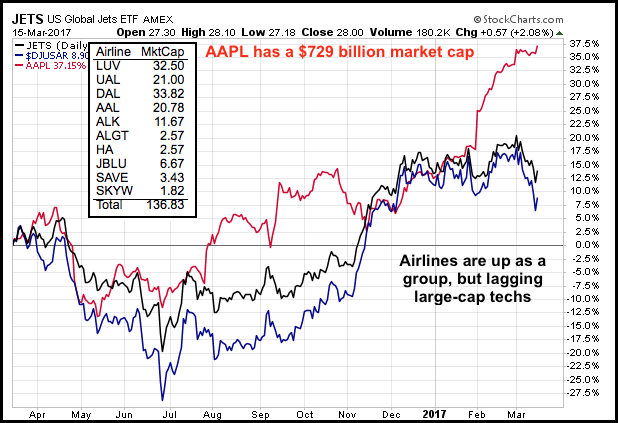
.... The Airline Group is Tiny, Really Tiny .... Comparing the Airline Index with the Airline ETF .... JETS Hits Oversold Zone .... The Big Three (AAL, DAL, UAL) .... Three Regional Carriers (HA, JBLU, SKYW) .... Where to Find a List of Airline Stocks ...... Read More
Art's Charts March 14, 2017 at 09:22 AM
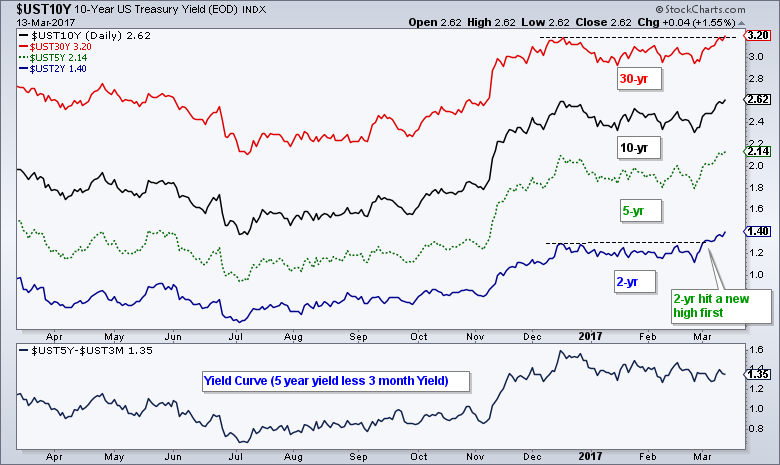
.... Bond Market Moves Ahead of the Fed .... S&P MidCap SPDR Becomes Short-term Oversold .... Copper ETN Pulls Back within Uptrend .... Valero and Marathon (Refiners) Hold Up within XLE .... Computer Associates, QQQ and New Highs ...... Read More
Art's Charts March 11, 2017 at 01:50 PM
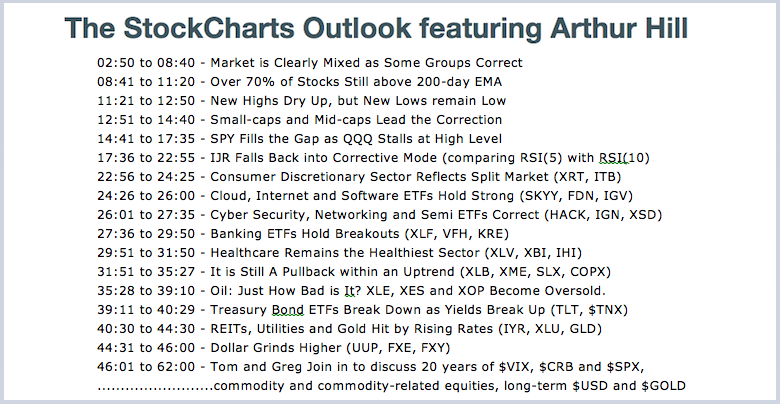
The image above shows the outline for the StockCharts Outlook webinar. Arthur added some color to the Weekly Market Review & Outlook by going over the each chart and expanding in some areas... Read More
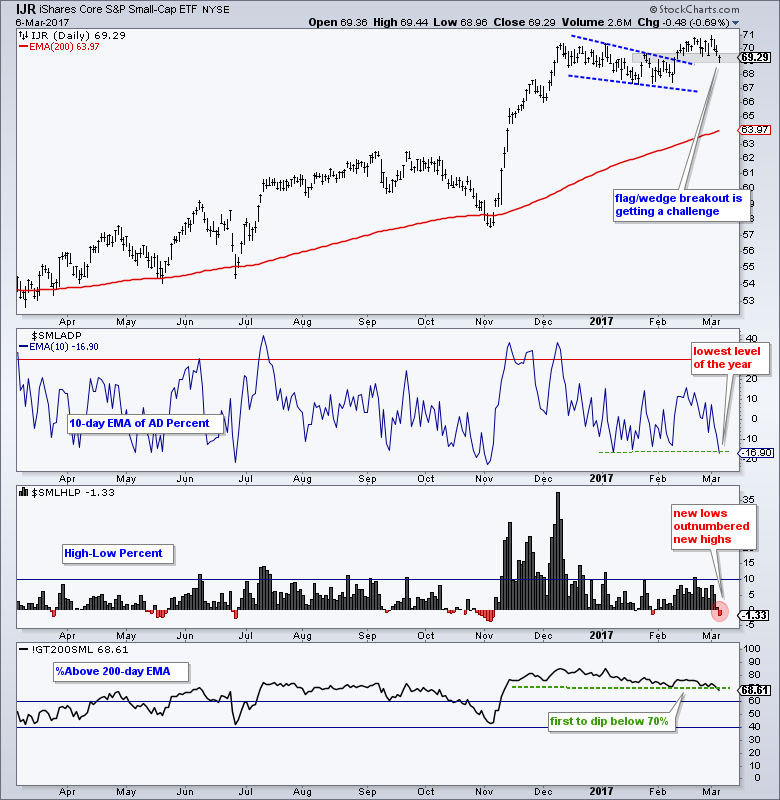
Art's Charts March 10, 2017 at 11:25 AM
.... Market is Clearly Mixed as Some Groups Correct .... Small-caps and Mid-caps Lead the Correction .... New Highs Dry Up, but New Lows remain Low .... Over 70% of Stocks Still above 200-day EMA .... SPY Fills the Gap as QQQ Stalls at High Level ...... Read More
Art's Charts March 09, 2017 at 10:07 AM
.... Failure for One Trader is Opportunity for Another .... Mean-Reversion Trades and Setups for IJR .... Backtesting Two Short-term Mean-Reversion Strategies .... Completed Trade and Current Setup for MDY .... Testing Five Major index ETFs ...... Read More
Art's Charts March 07, 2017 at 08:41 AM
.... Small-cap Breadth Deteriorates .... TLT Tests Support and 2-yr Yields Hits 52-week High .... Mind the Gaps in these 4 Bank Stocks .... Where to Check Earnings and News .... 12 Stocks with Bullish Charts ...... Read More
Art's Charts March 04, 2017 at 06:02 AM
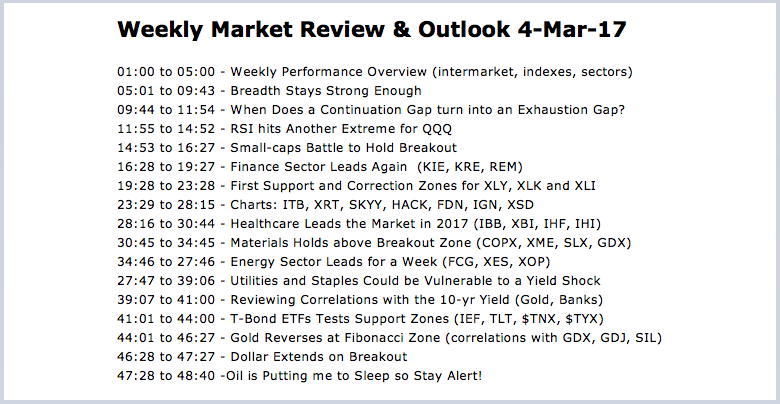
----- Video Link ----- Art's Charts ChartList (updated 4-Mar) ----- Weekly Market Review & Outlook 4-Mar-17 Financials, healthcare and energy stocks led the stock market higher this week with the S&P 500 SPDR, Nasdaq 100 ETF and S&P MidCap SPDR hitting new highs... Read More
Art's Charts March 03, 2017 at 03:10 AM

.... Introduction .... Review of the Testing Period .... Universe, Timeframe and Data .... Stock Market and Portfolio Benchmark .... Trend-Timing System using the PPO .... Different Faces of Momentum .... Market Filter, Trend Filter and Momentum .... Scanning Code Sample ...... Read More