.... Small-caps Take the Short-term Lead
.... But Small-caps are Still Lagging Long-term
.... IJR Surges Toward Chandelier Exit
.... 10-yr T-Yield Firms Near June Lows
.... Correlations with the 10-yr Yield
.... Brent Stronger that WTI
.... Two Bearish Stocks and One Bull ....
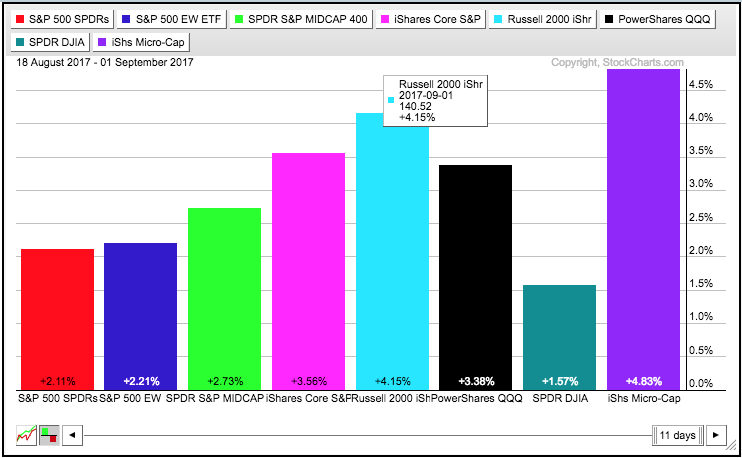
There was a shift in leadership over the last two weeks with small-caps outperforming large-caps (18-Aug to 1-Sep). Small-caps led the market lower from July 25th to August 18th as the S&P SmallCap iShares (IJR) fell around 7%. The ETF is now up around 4% from its low on August 18th. The PerfChart below shows the percentage gain for eight major index ETFs since August 18th (based on closing prices). IJR, the Russell 2000 iShares (IWM) and the Russell MicroCap iShares (IWC) are the clear leaders. SPY, the EW S&P 500 ETF (RSP) and the Dow Diamonds (DIA) are the laggards.
But Small-caps are Still Lagging Long-term
It is still too early to say if this is just a short-term blip or something more. The chart below shows three price relatives comparing small-caps to large-caps (IJR:SPY ratio), mid-caps to large-caps (MDY:SPY ratio) and small-caps to mid-caps (IJR:MDY ratio). Small-caps and mid-caps have been underperforming large-caps since December. There were a few outperformance pops (green arrows) that lasted 1-3 weeks, but these fizzled as the long-term underperformance trend took over. Thus, we need to see more than two weeks of relative strength before small-caps and mid-caps can declare victory over large-caps.

The bottom window on the chart above shows small-caps relative to mid-caps (IJR:MDY ratio). This ratio fell from early January to early April and then flattened out the last five months. The ratio dipped to a new low in August and then bounced over the last two weeks. We need to see a break above the June-July highs to signal that small-caps are outperforming mid-caps again.
IJR Surges Toward Chandelier Exit
The S&P SmallCap iShares (IJR) triggered three mean-reversion buy signals in August and continued lower after the first two. The third triggered when RSI moved above 30 and the EFT forged a moving star reversal. This mean-reversion system, however, does not consider candlestick patterns. It only buys when RSI(5) moves above 30 and sells when IJR closes below the Chandelier Exit. You can read the details here. The 22-day high is at 70.80 and 22-day ATR is .706, which means the Chandelier Exit (22,1) is at 70.09 (70.80 - .706 = 70.09). The Chandelier Exit fell over the last two weeks because the 22-day high fell. Price will exceed the Chandelier Exit at some point soon now and this will provide a setup for the sell signal. Chartists wishing to trail a stop from here can consider a close below 68.4, which would fill Thursday's gap.

10-yr T-Yield Firms Near June Lows
The finance sector is the second largest sector in the S&P SmallCap iShares (15.81%) and the 10-yr yield may hold the clue to the next move in smaller banks. The next chart shows the 10-yr T-Yield ($TNX) trending lower this year and the 20+ YR T-Bond ETF (TLT) trending higher. Keep in mind that Treasury yields and Treasury bonds move in opposite directions. I am watching $TNX because it firmed last week and is testing support from the June lows. The two semi circles show these lows around 21, which is 2.1% for the actual yield. The Raff Regression Channel defines the immediate downswing and I am marking resistance at 22.30. A close above this level would reverse the downswing and we could then consider a possible double bottom in the 10-yr Yield.

The lower window shows the 20+ YR T-Bond ETF (TLT) with a possible double top. Remember, "possible" is the key word because the bigger trend is still up and the double top has yet to be confirmed. A break below the July lows is needed to confirm this pattern.
Correlations with the 10-yr Yield
The direction of the 10-yr T-Yield ($UST10Y) is important to a number of groups, including gold. The next chart shows the actual 10-yr Yield, the 13-week Correlation Coefficient and its 13-week EMA for six symbols. Notice that the Finance SPDR (XLF) and Regional Bank SPDR (KRE) are positively correlated to the 10-yr Yield. This means they tend to move in the same direction. We can certainly see this in KRE because it is down double digits year-to-date.

Utilities and REITs are negatively correlated to the 10-yr yield because they are considered bond proxies. The consumer staples sector is also negatively correlated with the 10-yr yield and this could be because it is a defensive sector. Note that gold has a strong negative correlation with the 10-yr yield. Thus a bounce and breakout in the 10-yr Yield would be negative for gold.
Brent is Stronger that WTI
Both Brent Crude and Light Crude are in long-term downtrends, but I noticed that Brent held up much better over the last few weeks. The first chart shows the USO Oil Fund (USO) in the top window and November Crude (^CLX17) in the bottom window. The long-term trend is down because of the lower highs and 52-week low in June. November Crude bounced from mid June to late August and then pulled back with a falling wedge the last five weeks. This wedge, which defines the short-term downtrend, could be a correction after the June-July advance. Look for a move above 49 to trigger a breakout (10 in USO).

The next chart shows the US Brent Oil ETF (BNO) and November Brent (^BX17). The long-term trends are still down, but notice that these two formed pennants over the last few weeks and broke out with surges on Thursday. These breakouts are short-term bullish and argue for further gains, perhaps towards the 55-56 area. Further strength in oil could lift the beleaguered energy sector. The green zones mark support and breaks here would be bearish.

Two Bearish Stocks and One Bull
Disney (DIS) is one of the weakest Dow stocks this year with a year-to-date loss around 2%. SPY, in contrast, is up around 12%. The chart shows DIS failing to hold the late July breakout and reversing at the 61.8% retracement. The plunge and gap down in August broke below the June low. The stock has since stalled over the last four weeks with a flag and a break below flag support would signal a continuation lower.

CBS Corp (CBS) is also underperforming this year with a 1.7% gain year-to-date. The chart shows CBS peaking below the April high and breaking the channel line with a sharp decline in early August. Admittedly, these channels lines seem a bit steep. Those looking for a different perspective can set the date range from mid May to early September. In any case, I view the lower high, channel break and relative weakness as negative and would expect further downside in CBS.

Charles Schwab (SCHW) is a discount broker with a positive correlation to the 10-yr T-Yield ($TNX). This means SCHW tends to rise and fall along with the 10-yr Yield. SCHW is in an uptrend this year with a higher high and 52-week high in July. The stock was hit hard in mid August, but managed to firm in the 39 area and break a short-term resistance level. It looks like a higher low is forming and SCHW is trying to resume its bigger uptrend.

******************************************************
ETF Master ChartPack - 300+ ETFs organized in a Master ChartList and in individual groups.
Follow me on Twitter @arthurhill - Keep up with my 140 character commentaries.
****************************************
Thanks for tuning in and have a good day!
--Arthur Hill CMT
Plan your Trade and Trade your Plan
*****************************************
