.... Bollinger Bands Contract for Dow SPDR (plus BA and GS)
.... QQQ Holds Breakout Zone
.... Setting a Pullback Target for Apple
.... A Boring Uptrend for Microsoft
.... Facebook Breaks Wedge Line
.... Alphabet and Amazon are the Weakest Links
.... Mea Culpa on Intel and Target
.... Charts Worth Watching (CY, PFE, AMGN, AGU, POT) ....
Bollinger Bands Contract for Dow SPDR (plus BA and GS)
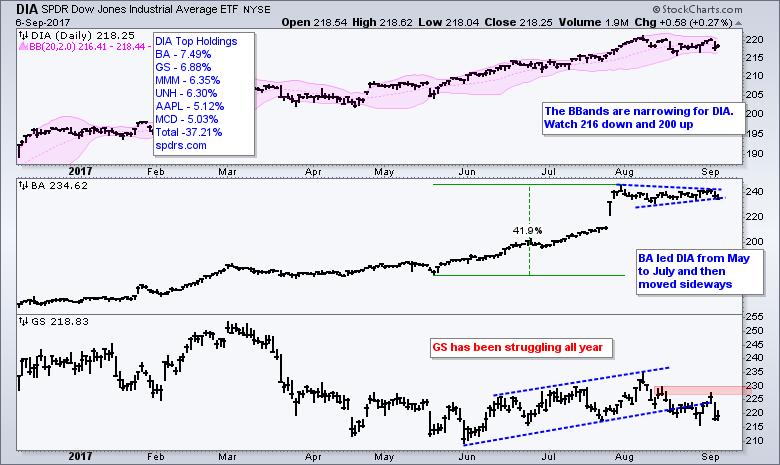
An index or ETF is only as good as its component stocks. The number of "important" stocks depends on the structure of the ETF and the weightings of these components. For example, QQQ and the sector SPDRs are weighted by market cap and this means the stocks with the highest market caps carry the most weight. The Dow Diamonds (DIA) and Dow Industrials are weighted by price and this means the stocks with the highest price carry the most weight (BA, GS, MMM, UNH, AAPL). The chart below shows DIA stalling out the last five weeks and the Bollinger Bands narrowing.
QQQ Holds Breakout Zone
The chart below shows QQQ with the top ten components on the left. Notice that the top five account for around 42% of the ETF. Thus, we should watch these five stocks for clues and I will analyze each one today. First, QQQ broke out last week and hit another new high three days ago (Monday). The ETF fell back on Tuesday and tested the breakout zone in the 143-144 area. A close below 143 would negate the breakout and argue for a correction, perhaps. I say "perhaps" because the long-term trend is clearly up and this is the dominant force at work.

Setting a Pullback Target for Apple
Apple (AAPL) is the clear leader in the Nasdaq 100 ETF (QQQ), and it is the biggest component (12.43%). The current run up (~16%) is in anticipation of the company event on September 12th, next Tuesday. Gene Munster of Loup Ventures expects a "tail off" after the announcement of the new iPhone and perhaps a 10% pullback. This would be a classic buy-the-rumor and sell-the-news scenario. Looking at the price chart, the stock hit a new high three days ago and I see nothing to suggest impending weakness. It is, however, certainly possible that Apple could pullback into the 145-150 area. A 10% decline from the current high would extend to around 150 and the early August gap zone resides in the 150-154 area.

There are two other items to consider. First, the trend line extending up from the spring lows extends into the upper 140s. As far as I am concerned, this trend line measures the rate of ascent for two or more rising troughs. Should this rate of ascent hold, I would expect Apple to bounce in the upper 140s on a pullback. A trend line break would signal a change in the rate of ascent, but not necessarily a trend reversal. Second, I would watch for RSI(10) to move to the 30 area, which would suggest a short-term oversold condition. RSI(10) moved below 30 during the June decline when Apple fell around 9%.
A Boring Uptrend for Microsoft
Microsoft is also in a clear uptrend and leading with a 52-week high four days ago. The stock fell back over the last three days, but a pullback at this stage would still be considered a correction within a bigger uptrend. The July breakout zone, August lows and green trend line combine to mark an area to watch for support should we see a pullback. The indicator window shows RSI(10) dipping below 40 in June and August, but not reaching 30. The ability to hold above 30 is testament to the steadiness of the underlying uptrend.

Facebook Breaks Wedge Line
Facebook (FB) hit a 52-week high after a surge in July and then corrected with a falling wedge in August. It looks like this correction ended with the surge and break above 170 last week. A strong breakout should hold and I would watch the 168-170 area for the first signs of failure. A close below 168 would signal a failed breakout and we could then see a deeper pullback. As with APPL, the uptrend in Facebook could withstand a 5 to 10% decline.

Alphabet and Amazon are the Weakest Links
Alphabet (GOOGL) has been lagging the broader market since June, but support at 920 is still holding as the stock attempts to bounce. GOOGL peaked in June, formed a lower high in July and fell to 920 with a gap down. The stock firmed in this area during the second half of August and then surged with a three day bounce above short-term resistance. Even though the stock fell back over the last three days, I think the cup is half full because the majority of the 3-day bounce is holding. A close below 935 (green dashed line) would turn the cup half empty.

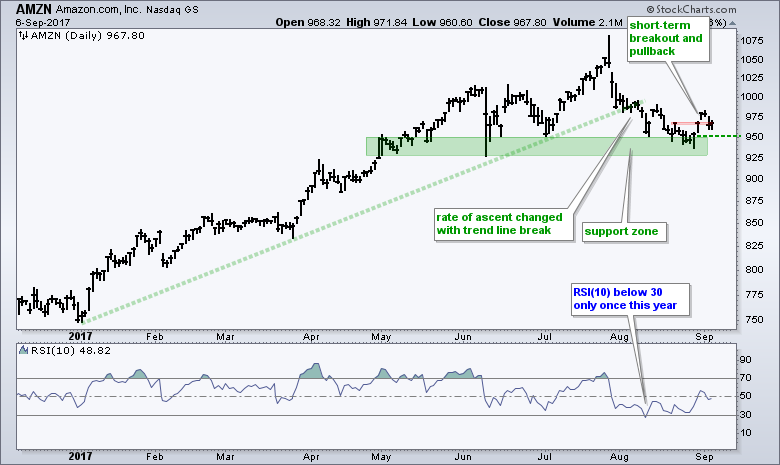
Amazon (AMZN) also bounced off a support zone with a three day surge. The stock fell back on Tuesday, but most of this surge is holding. A close below 950 (green dashed line) would negate this surge and point to lower prices.
Mea Culpa on Intel and Target
I am first revisiting two charts from late August because my analysis proved wrong. I wrote about Intel on August 29th because it did not bounce with the rest of the market and was in a downtrend. Instead of breaking down further and confirming my bearish bias, the stock turned up and surged 3%. The bigger downtrend remains, but the ability to hold after a normal retracement (61.8%) is positive, as is the strong upturn. This behemoth has been lagging the semiconductor group and renewed strength would be positive for semis and techs.

I also wrote negative on Target (TGT) in DITC on August 28th. Instead of building on the bearish engulfing and continuing lower, the stock held support at 54 and surged the last three days. An inverse head-and-shoulders formed and the stock is challenging resistance.

Chart reading is subjective and this means we are going to be wrong at times. The key is to learn from these mistakes and avoid them in the future. Here are some takeaways from these bogus reads. First and foremost, we are in a bull market. This means we should be looking for bullish setups and avoiding bearish setups. I am not sure if I would have done anything different on Target, but I see the error in my ways on Intel. As far as Target, retail was lagging and the 50-day EMA was below the 200-day EMA. There were some bigger negative forces at work for TGT. As far as Intel, the technology sector was leading and its 50-day EMA was above 200-day EMA. There were some bigger positive forces at work for Intel and I should have taken these into consideration.
Charts Worth Watching (CY, PFE, AMGN, AGU, POT)


******************************************************
ETF Master ChartPack - 300+ ETFs organized in a Master ChartList and in individual groups.
Follow me on Twitter @arthurhill - Keep up with my 140 character commentaries.
****************************************
Thanks for tuning in and have a good day!
--Arthur Hill CMT
Plan your Trade and Trade your Plan
*****************************************
