.... 52-week Highs Reflect Broad Strength
.... Materials, Industrials and Technology Lead New High List
.... Alphabet, Amazon and Facebook are Dragging
.... CSCO Hits Multi-Month High
.... Fiserv Turns Up after Pullback
.... AMD Bounces off Key Retracement
.... CHD and CL Start Turning UP
.... How to Handle Overvalued Stocks ....
52-week Highs Reflect Broad Strength
Large-caps, semiconductors and biotechs are leading the market overall. I say "overall" because their respective indexes and ETFs hit 52-week highs this month. Small-caps, energy, metals & mining and retail are leading over the past month because they have the largest gains. Their respective ETFs, however, have yet to hit new highs. Nevertheless, there is clearly broad strength in the stock market and this is why the EW S&P 500 ETF (RSP) hit a fresh 52-week high on Monday. The chart below shows RSP along with the Nasdaq 100 ETF, S&P 500 SPDR, S&P MidCap SPDR and S&P SmallCap iShares. The green vertical lines show all five hitting 52-week highs around the same time. These new highs occurred in early March, late April, mid June and late July. Most recently, RSP, SPY and QQQ hit fresh 52-week highs in mid September.
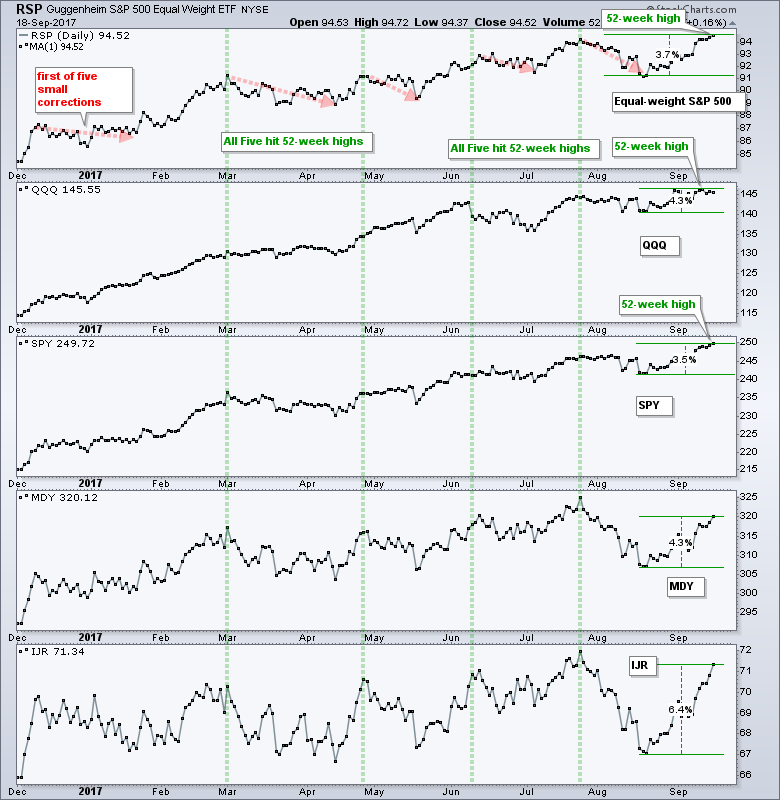
The chart above also shows the percentage gain tool measuring the gains from August 18th to September 18th. RSP, QQQ, SPY and MDY are up between 3.6% and 4.4%. The S&P SmallCap iShares is leading them all with a 6.3% gain and the ETF is within spitting distance of a 52-week high. Thus, the death of small-caps was greatly exaggerated four weeks ago. With the parade of new highs in July, the decline into August was always viewed as a correction within a bigger uptrend. Some pundits suggest that we have not seen a correction since October last year, but I would argue to the contrary. The red arrows on the RSP chart (top) show five small corrections since December. Surely, five small corrections are equivalent to one "normal" correction.
Materials, Industrials and Technology Lead New High List
The next chart shows High-Low Percent for the S&P 500 and the nine sectors. High-Low Percent equals new highs less new lows divided by total issues. The chart is sorted by Monday's High-Low Percent value with the highest at the top and lowest at the bottom. Materials, industrials and technology have the most new highs with High-Low Percent at 25% or higher. Technology has always been leading, and we are now seeing a resurgence in the industrials sector.

Alphabet, Amazon and Facebook are Dragging
QQQ is dragging its feet this month and the ETF is down .23% in September. In contrast, the S&P SmallCap iShares (IJR) is up 3.29% and leading the major index ETFs. Weakness in QQQ stems from weakness in Alphabet, Amazon and Facebook. SPY hit another new high this week, but Amazon and Alphabet remain well below their 52-week highs. I do not want to bet against these stocks because the long-term trends are up, we are in a bull market and the technology sector is leading. However, it appears that other areas of the market are more promising right now. The first chart shows Amazon breaking out with a three day surge in late August. The breakout zone and early September low now mark first support at 960. AMZN broke the wedge line with Monday's decline and a close below 960 would negate the breakout.

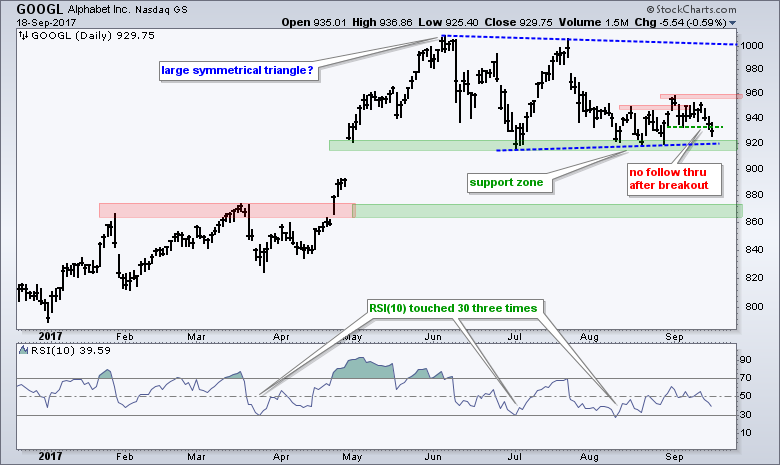
The next chart shows Alphabet, which I still call Google, bouncing off support and breaking out in late August. The stock fell back to the 940 area and tried to firm, but fell back below the early September low this week. GOOGL is down 2.67% so far in September and this means there is more selling pressure than buying pressure in Alphabet this month.
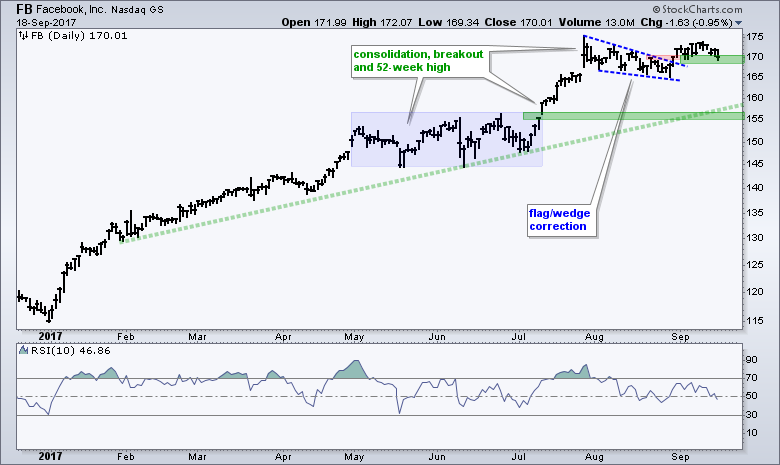
The next chart shows Facebook with a wedge breakout in late August and no follow through after the breakout. Instead, the stock waffled in the 168-173 area the last two weeks. A close below 167 would negate the breakout and argue for a deeper correction.
CSCO Hits Multi-Month High
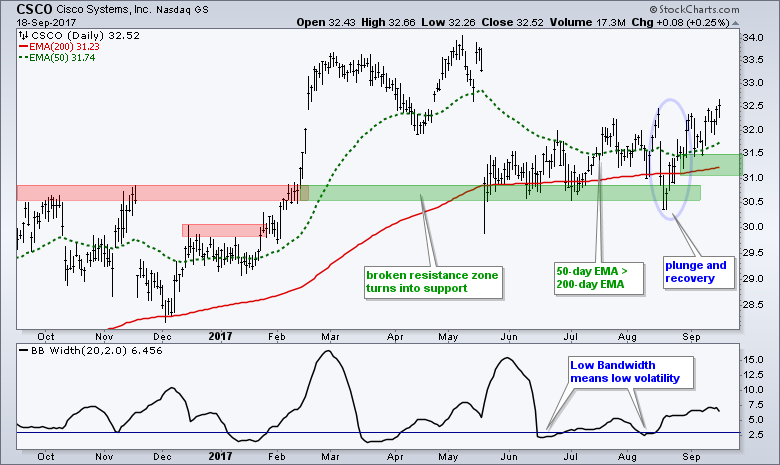
In contrast to Amazon and Google, Cisco is up month-to-date and showing some upside leadership. Also note that Microsoft hit a 52-week high on Monday. I highlighted the CSCO chart last week and will show it again this week. The stock bounced off the support zone in late August and filled the gap (blue oval). With further gains the last two days, Cisco exceeded the August high and shows some relative strength this month. I would mark support in the 31-31.5 area and re-evaluate on a close below 31.
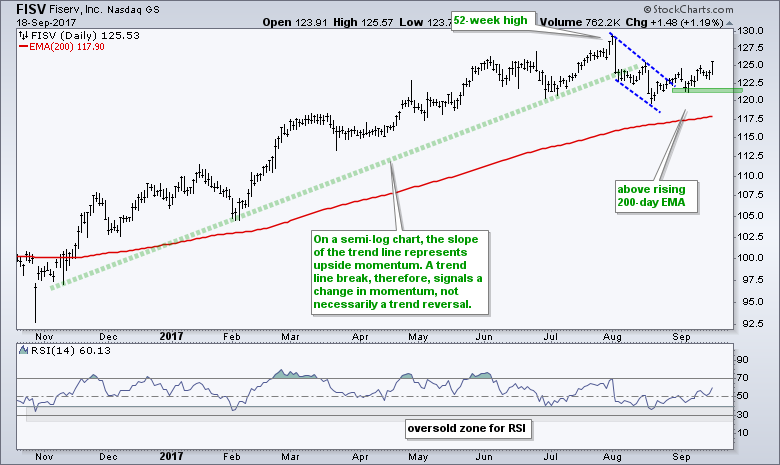
Fiserv Turns Up after Pullback
The next chart shows Fiserv breaking out after a pullback and mild oversold condition. Note that Fiserv provides technology services for debit/credit card processing, electronic payments and mobile/internet banking. The stock broke a trend line in late July, but this just signaled a change in momentum, not a change in trend. In addition, pullbacks within an uptrend are considered corrections and opportunities. RSI dipped into the oversold zone in mid August and the stock turned up over the last few weeks. Given the uptrend and upturn, I would expect FISV to hit a new high in the coming weeks or months.
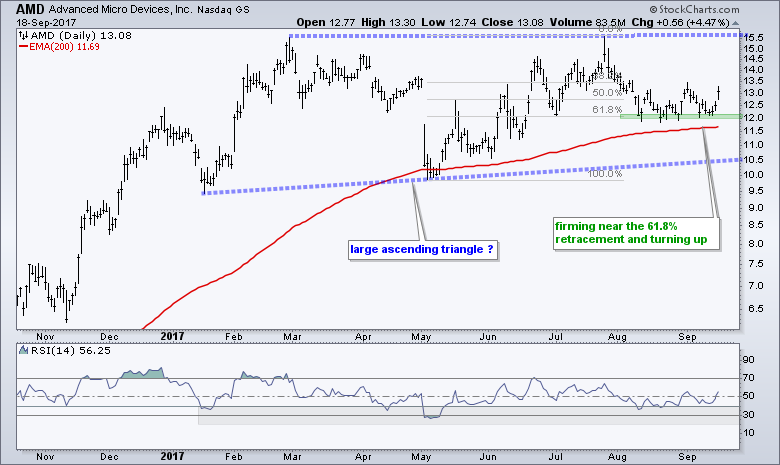
AMD Bounces off Key Retracement
AMD is a chipmaker that competes with Intel and a few other chip manufacturers. It is a tough business and AMD has struggled for years. The stock was trading around $2 in January 2016 and hit the $15 area in February 2017. AMD has since moved into a large trading range and I am seeing signs of strength in the middle of this range. The July-August decline retraced around 61.8% of the May-July advance and the stock firmed in the 12 area. AMD surged off support the last three days and could be poised to make a run at resistance. Caveat Emptor: This is a low priced stock with above average risk.
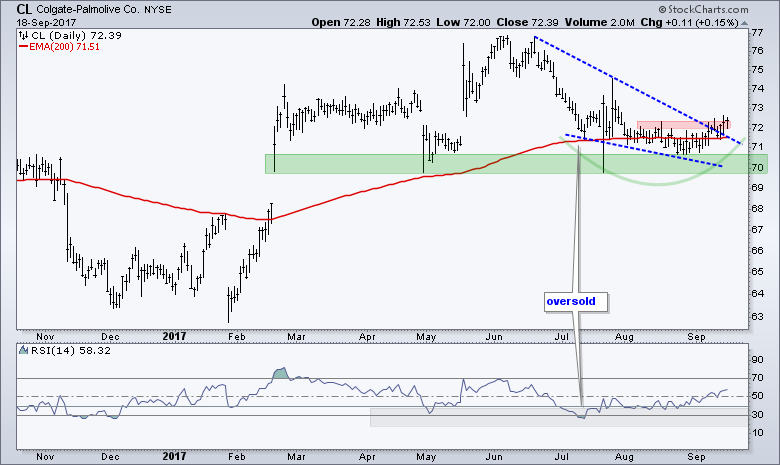
CHD and CL Start Turning UP
Church & Dwight (CHD) and Colgate Palmolive (CL) are both from the consumer staples sector. Both companies develop, manufacture and market household and personal care products. Both stocks hit new highs this summer, corrected into August and turned up over the last few weeks. CL broke the wedge line and exceeded its mid August high. CHD surged off support the last four days and is poised to break short-term resistance.

Investor Field Guide and Dealing with Overvalued Stocks
I make my trading and investing decisions based on the charts, but I always have a general idea regarding the fundamental story behind a stock. I do not know any of the valuation metrics, such as the EV to EBITDA ratio, price to book and such. Instead, I have a general idea of the business, the story behind the stock and the sector.
Patrick O'Shaughnessy of Investor Field Guide interviewed David Gardner of the Motley Fool. They are both fundamentally oriented investors, but they have very different styles. O'Shaughnessy is a classic value investor, while Gardner looks for the big growth stories. I paraphrased two parts of the interview that caught my attention. The whole podcast is worth a listen.
Finding Companies That Break the Rules with David Gardner of the Motley Fool
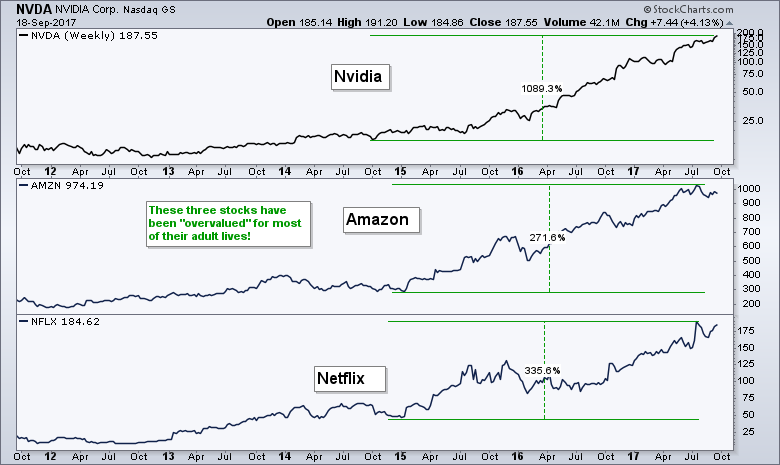
~25 minute mark - Gardner: Out of all my stock picks, only half have beaten the market. The good news is, the ones that beat the market wiped out all the losses - and much more. All you need is a few BIG winners. O'Shaughnessy: Statistically, the best returns come from stocks that begin their run in the most expensive statistical bucket (overvalued). However, as a group, the most expensive stocks are the worst performing. Thus, value beats growth as a group, but the big individual winners start out overvalued and remained overvalued throughout their runs (think AMZN, NVDA, NFLX).
~44 minute mark - Gardner: The worst phrase ever invented is "buy low and sell high". When a stock makes a 10% gain, it is more likely to make ANOTHER 10% gain (momentum). Momentum is true in business and life. The winners keep on winning.
******************************************************
ETF Master ChartPack - 300+ ETFs organized in a Master ChartList and in individual groups.
Follow me on Twitter @arthurhill - Keep up with my 140 character commentaries.
****************************************
Thanks for tuning in and have a good day!
--Arthur Hill CMT
Plan your Trade and Trade your Plan
*****************************************
