- Indicators Improve as S&P 500 Follows Through.
- A Retest of the February Low?
- Monitoring the Pennant Breakout.
- Oil Bounces off Breakout Zone.
- Use Continuous Contract Long-Term.
- Oil & Gas Equip & Services SPDR Firms.
- Haliburton Returns to Breakout Zone.
 Indicators Improve as S&P 500 Follows Through
Stocks bounced with the S&P 500 closing at its highest level since February 2nd. This means the index closed above last week's closing high and achieved a breakout of sorts (red dashed line). Wednesday's 1.34% advance also represents follow through to Friday's reversal day and SPY broke out of its two day pennant.
The chart below shows further improvement with RSI bouncing from oversold levels (<30), the S&P 500 Volatility Index ($VIX) moving back below 20 and S&P 500 %Above 50-day EMA (!GT50SPX) moving out of its oversold zone. Even though option expiration affected the VIX on Wednesday, I will take the move below 20 at face value and consider it positive.
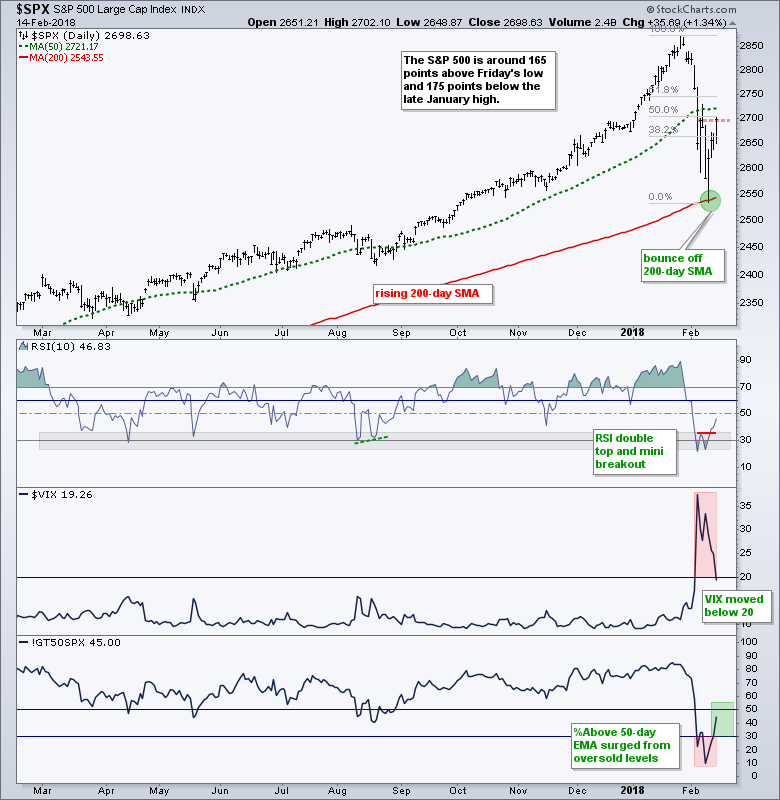
At this point, the S&P 500 is around 165 points off the February low and 175 points below the late January high. In short, the bounce from the 200-day SMA retraced around 50% of the prior decline. Cue Stealers Wheel and Stuck in the Middle with You from Top of the Pops.
A Retest of the February Low?
The big concern right now is that the bounce fizzles and we get a retest of the 9-Feb low. After the 10+ percent plunges in August 2015 and January 2016, the S&P 500 bounced 6-8% and retraced 50-61.8% of the prior decline. There was then a retest of the lows after seemingly strong bounces.
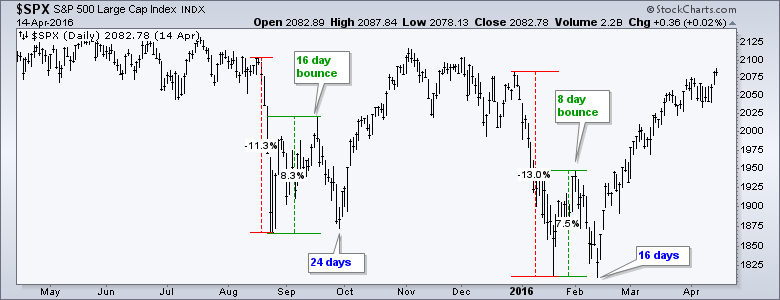
The chart above shows an 8 day bounce in August 2015 and 24 days separating the two lows. The index bounced in January 2016 for eight days and then retested the January low. There were 16 days separating the January low and the February low.
Monitoring the Pennant Breakout
The chart below shows 30-minute bars for the S&P 500 SPDR (SPY) and I will use this to monitor the current bounce. A 50-61.8% retracement and 7-8% bounce from the lows would extend to the 270-274 area. This is a potential reversal zone to watch in the coming days.
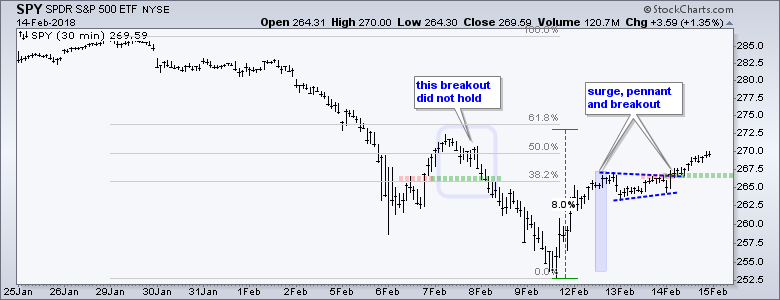
Even though a reversal zone may be approaching, the short-term trend is up and the pennant breakout is bullish until proven otherwise. This means the pennant breakout is the first level to watch for a failed breakout. A move back below 266.5 would negate the breakout and could evolve into a retest of the February low.
Oil Bounces off Breakout Zone
The USO Oil Fund (USO) and Light Crude Continuous Contract ($WTIC) fell back to their breakout zones last week and these zones mark the top of support zones. Also notice that the decline retraced around a third of the June-January advance. After firming for two days, oil surged on Wednesday and this is the first sign that the bigger uptrend is continuing.
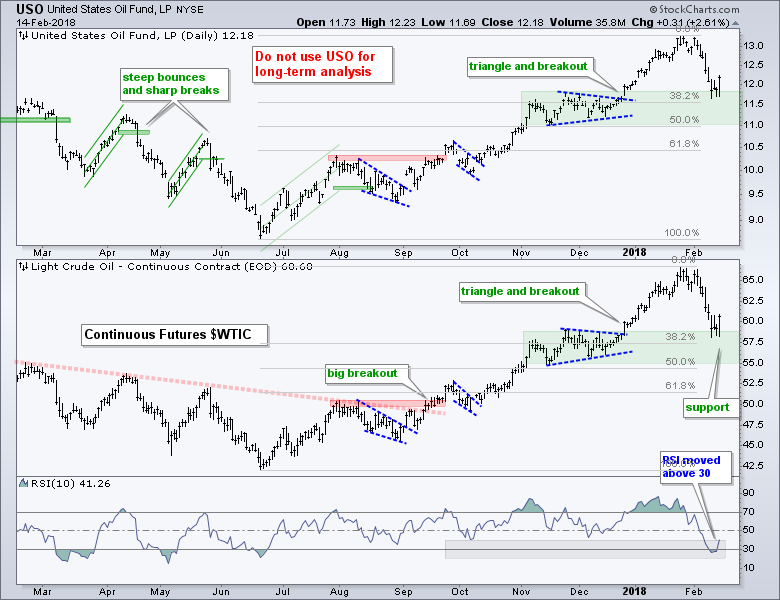 The indicator window shows RSI dipping below 30 for the first time since June. Thus, this is the first oversold reading since the uptrend began. The move back above 30 means oversold conditions have subsided also points to a resumption of the bigger uptrend.
Use Continuous Contract Long-Term
The chart below shows why I do not use USO for long-term analysis. USO is up 52.4% over the last two years, but the Light Crude Continuous Contract ($WTIC) is up 122%. $WTIC is not perfect because it is stitched together with futures contracts as they expire. However, it tracks oil much better than USO over the long-term.
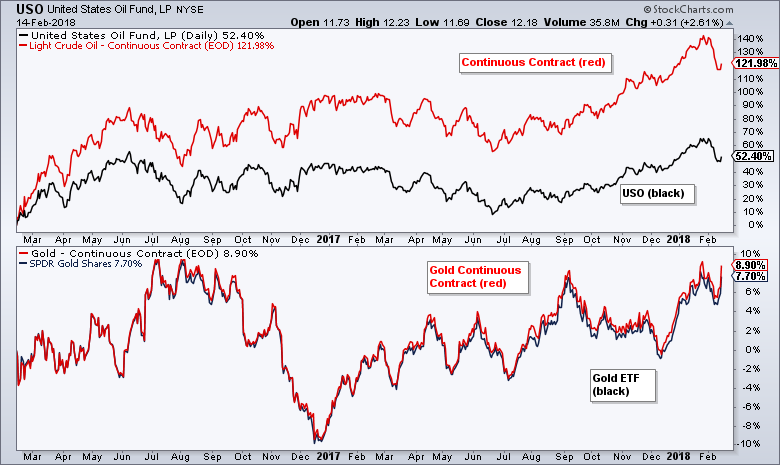 The bottom window shows the Gold SPDR (GLD) and the Gold Continuous Contract ($GOLD). The gold ETF tracks the continuous contract quite well so there is a not a real issue here. The oil ETF has tracking issues because of the term structure of the futures contracts and rollover issues. This is also true with UNG.
Oil & Gas Equip & Services SPDR Firms
The Oil & Gas Equip & Services SPDR (XES) is also at an interesting juncture because it retraced around 61.8% of its prior advance and firmed near support from the November-December lows. RSI became oversold and moved back above 30 this week.
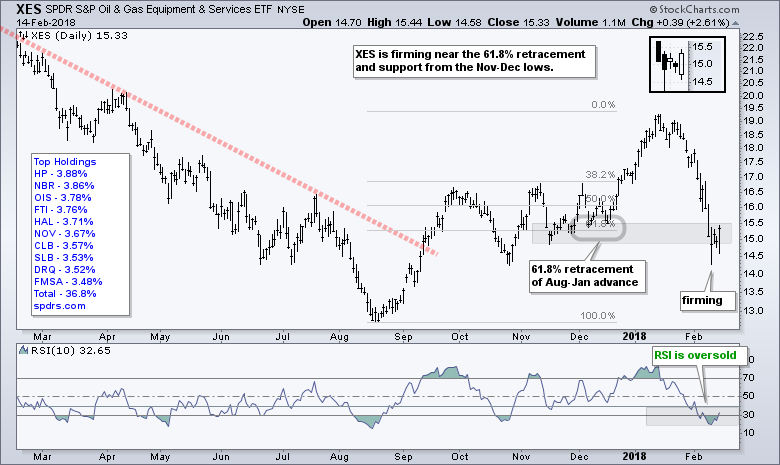 Even though I am not using candlesticks, note that a big bullish engulfing formed on Wednesday and this further affirms support in the 15 area (see inset on chart). A close below 14.50 would suggest a failure and call for a re-evaluation.
Haliburton Returns to Breakout Zone
The next chart shows Halliburton (HAL) with a head-and-shoulders breakout in mid December and surge to the upper 50s. The stock fell hard over the last few weeks, but returned to broken resistance and firmed the last few days.
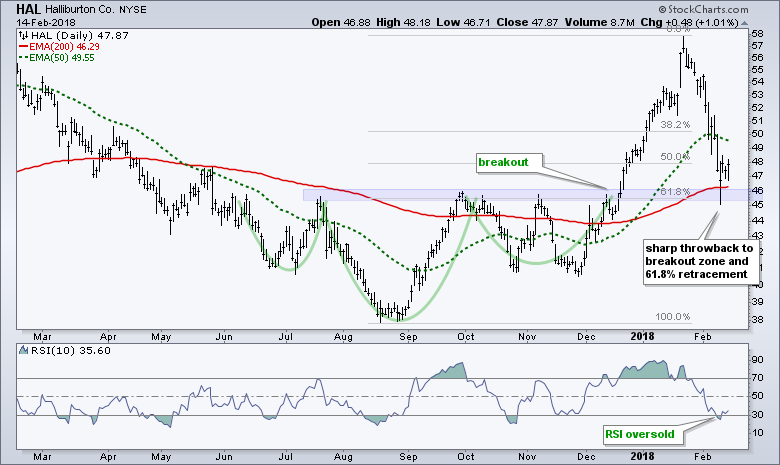 In addition to broken resistance turning into support, the stock retraced around 61.8% of the prior advance and this is a potential reversal zone. Also notice that RSI moved below 30 last week and back above 30 this week.
Plan Your Trade and Trade Your Plan.
- Arthur Hill, CMT
Senior Technical Analyst, StockCharts.com
Book: Define the Trend and Trade the Trend
Twitter: Follow @ArthurHill
