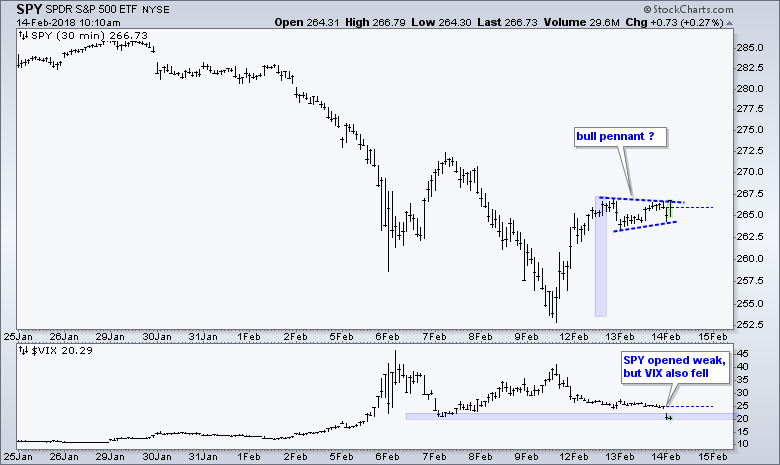
 There is another disconnect working between the VIX and SPY. The S&P 500 SPDR (SPY) opened weak with a dip below 265, but the S&P 500 Volatility Index ($VIX) also declined. This is an interesting dynamic because the VIX usually moves opposite of SPY. I am also intrigued that SPY opened weak and quickly rebounded.
Note that this disconnect could also be due to the options expiration for VIX contracts because many expire today (14-February). See the CBOE website for more details.
The current correction started when SPY and the VIX were moving in the same direction. As noted in Art's Charts on January 30th (members only), both the VIX and the S&P 500 rose from mid-January to late January and this disconnect warranted caution at the time.
While I still think the current correction has yet to fully run its course, we could still see a counter-trend bounce and today's VIX action warrants a close watch on the pennant taking shape in SPY.
Keep in mind that this is very short-term analysis that is subject to change quite quickly.
The chart below shows SPY surging from 253 to 267 and then stalling the last day or so with a pennant. A break to the upside (>267) would be bullish and argue for a continuation of the advance from Friday afternoon to Monday. A break to the downside (<264) would argue for a continuation of the February downtrend.
The indicator window shows the VIX opening lower and testing the 20 area. A move below 20 would be significant because it would suggest that fear is subsiding and this could be the catalyst for further upside in SPY.
Plan Your Trade and Trade Your Plan.
- Arthur Hill, CMT
Senior Technical Analyst, StockCharts.com
Book: Define the Trend and Trade the Trend
Twitter: Follow @ArthurHill


