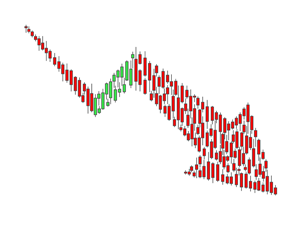
- Bearish Patterns in Big EW Sectors.
- Internal Weakness Hits Consumer Staples.
- Semiconductor ETFs Bounce after Breakdowns.
- Intel Fails at 200-day as Broadcom Breaks Out.
- Four more Wedge Breaks.
- On Trend on Youtube.
 ... Bearish Patterns in Big EW Sectors
... While the sector SPDRs capture what is happening with large-cap stocks, the equal-weight sectors provide a more balanced approach to sector analysis. As the name implies, the components in the equal-weight sectors are more evenly distributed and these sector ETFs show us how the ”average" stock in the sector is performing. And it ain't pretty.
The charts below show the five largest equal-weight sector ETFs. The Communication Services does not have an equal-weight version, yet. First and foremost, notice that all five are below their 200-day SMAs. The EW Healthcare ETF (RYH) is just a few cents below and can be considered the "least weak" of the five. Nevertheless, RYH formed a rising wedge the last six weeks and this is a bearish continuation pattern. A breakdown here would target a test of the spring lows.
The other five ETFs show bearish continuation patterns as well. The EW Technology ETF (RYT) sports a descending triangle, while the EW Consumer Discretionary ETF (RCD) and EW Finance ETF (RYF) formed triangles after sharp declines. The triangles represent a rest after the prior declines. The recent breakdowns signal a continuation of these declines. The EW Industrials ETF (RGI) formed a rising wedge and broke down here in early December.
I am not pointing out these patterns for potential short positions. Instead, they show broad weakness in the stock market and affirm my bearish stance on stocks.
Internal Weakness Hits Consumer Staples
The Consumer Staples SPDR (XLP) held up relatively well during recent market turmoil, but all is not so well when looking at the internals. The chart below shows the Consumer Staples SPDR (XLP) with a higher high in November and the EW Consumer Staples ETF (RHS) with an equal high. XLP is comfortably above its flat 200-day SMA, but RHS is quite close to this moving average. The equal-weight consumer staples ETF is clearly not as strong as the large-cap consumer staples SPDR.
The breadth indicators show internal weakness because XLP High-Low% ($XLPHLP) dipped below -20% three times this month and this means quite a few stocks in the sector hit new 52-week lows. There are 33 stocks in the sector and 7 hit new lows recently. The Staples %Above 200-day EMA (!GT200XLP) is currently hovering around 50%. This means around half the stocks in the sector are in uptrends and half are in downtrends. The large-cap stocks are keeping XLP afloat, but the average stock in the index is not faring as well.
Semiconductor ETFs Bounce after Breakdowns
The next chart shows the Semiconductor SPDR (XSD) and the Semiconductor iShares (SOXX) breaking down in October and rebounding back to the broken support zones. XSD formed a rising wedge and fell to the lower trend line this week. SOXX did not make it back to the 200-day SMA and fell back toward its late November low.
Overall, these two are NOT "On Trend". They are definitely not in uptrends and trading turned quite volatile after the October breaks. It is very hard to make money shorting stocks or ETFs because volatility increases and counter-trend bounces can be very sharp. All it takes is one headline. The bigger downtrends are what really matter here. Thus, the bounces from late October to early December are considered counter-trend moves and the bigger downtrend is expected to continue at some point.
Intel Fails at 200-day as Broadcom Breaks Out
The next chart highlights five semiconductor stocks. First, only one is above its 200-day SMA and showing any kind of strength. Broadcom (AGVO) was also the only one to form a higher low from July to October. The stock showed less weakness and then broke a triangle line with a surge on Tuesday.
The other four stocks sport rising wedge breaks. The rising wedge is a bearish continuation pattern that forms as a counter-trend bounce. These wedges alleviated oversold conditions from late October. INTC and ADI returned to their 200-day SMAs and then turned down. TXN and KLAC fell short of their 200-day SMAs and broke their wedge lines.
Four more Wedge Breaks
The next chart shows two industrial stocks (MMM and CAT) and two materials stocks (PPG and SHW). All four are below their 200-day SMAs and all four recorded 52-week lows in late October. Thus, the long-term trends are clearly down. The rising wedges are considered counter-trend bounces and it looks like these bounces are reversing.
On Trend on Youtube
Available to everyone, On Trend with Arthur Hill airs Tuesdays and Thursdays at 10:30AM ET on StockCharts TV and repeats throughout the week at the same time. Each show is then archived on our Youtube channel.
Topics for Tuesday, December 11th:
- SPY, MDY and IJR Break Triangle Lines.
- XLF, XLI and XLE Lead Sectors Lower.
- Finance-related ETFs Weigh (KRE, IAI, KIE).
- Treasuries Remain Strong and Junk Weak.
- Some Tech-related ETFs Hold Up, BUT....
- Stocks to Watch (AMZN, HRB, BIIB...)
- Click here to Watch
- Arthur Hill, CMT
Senior Technical Analyst, StockCharts.com
Book: Define the Trend and Trade the Trend
Twitter: Follow @ArthurHill


