- Setting the Stage.
- Defining the Death Cross.
- 9 of the Last 2 Bear Markets.
- Comparing Different Crossover Signals.
- SMAs versus EMAs.
- SPY with Dividends vs $SPX Without.
- The Moving Average Sweet Spot.
- Conclusions (Adjusting Exposure).
 ... Setting the Stage ...
The financial media is awash with reports on the "death cross" in the S&P 500, but many of these reports fail to capture the true value of such signals. While past performance does not guarantee future performance, we can learn from the past and better understand moving average signals. This System Trader article will test and analyze various moving average crossover signals for the S&P 500.
Instead of testing the classic death cross with the S&P 500, this article will test crosses of the 200-day moving average using various short-term moving averages. The test will also compare simple moving averages with exponential moving averages and see if short positions add or detract from system performance. Moving average crosses can capture extended uptrends on the long side and prevent big drawdowns, but they do not work very good when short positions are added.
Defining the Death Cross
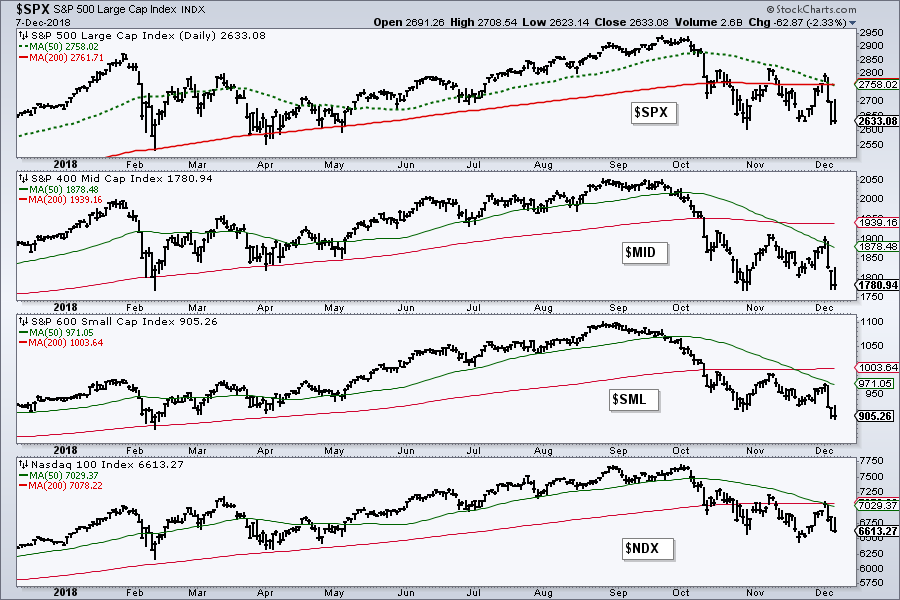
A classic death cross occurs when the 50-day simple moving average moves below the 200-day SMA. We have seen death crosses in the S&P Mid-Cap 400 on November 13th, the S&P Small-Cap 600 on November 20th and the Nasdaq 100 on December 4th. The S&P 500 is the latest index to join the party with a death cross on Friday. The Dow Industrials remains the hold out because the 50-day SMA is around 1.5% above the 200-day SMA.
9 of the Last 2 Bear Markets
The testing period covers the S&P 500 over the last twenty years, which includes two bear markets, two big bull runs and some volatile periods. The chart below shows the S&P 500 from 12/1998 to 12/2018. Notice that the 50-day SMA started above the 200-day SMA, which is the first signal, and there were eight golden crosses after this (green lines). On the flipside, there were nine death crosses (red lines). The most recent occurred on Friday.
 These signals are not perfect and there are whipsaws. Good luck finding an indicator without whipsaws and good luck trying to curve fit. Despite its imperfections, the indicator caught some good uptrends and avoided the two bear markets. Those looking for a negative connotation could proclaim that the death cross predicted nine of the last two bear markets. In other words, six signals did not result in bear markets but two did. The tenth signal occurred last week.
The death cross is like an insurance policy against a big drawdown. It does not always work and you do not always need it, but it is nice to have when/if the big one hits.
Comparing Different Crossover Signals
So how does the death cross compare to other moving average crossover signals? The table below shows performance results when using the 200-day for the long-term (slower) moving average and various short-term (faster) moving averages (1, 5, 20 and 50). The Compound Annual Return ranged from 3.39% to 6.38% and increased as the length of the slower moving average increased (green outline). Notice that exposure was around 70% for all four backtest, which means the systems were long the S&P 500 around 70% of the time and out the other 30%. The Win% and Average Gain also increased as the length of the short-term moving average increased.
 The Maximum Drawdown (red outline) for buy-and-hold was 56% and occurred during the 2008-2009 bear market. This means the portfolio was down 56% at the low of the 2008-2009 bear market. There was also a 46% drawdown during the 2001-2002 bear market. Thus, there were two drawdowns averaging 50% over the last twenty years. The Maximum Drawdown halved when using a cross above the 200-day SMA for signals and dropped to the 20% range when short-term moving averages were used.
The Maximum Drawdown could be viewed as the maximum risk to your portfolio when trading the system. A simple moving average crossover system can clearly reduce risk because the Maximum Drawdowns fell significantly when a moving average signal was added.
SMAs versus EMAs
The next tests will use the same parameters with exponential moving averages instead. Before looking at the results, note that simple moving averages sometimes work better than exponential moving averages and EMAs sometimes work better than SMAs. Neither one has a clear edge and this edge is subject to change. Often, it depends on your personal preference and your preferred performance metrics.

SPY with Dividends vs $SPX Without
The results for the S&P 500 do not include dividends. While dividends might not make much of a difference in short-term trading, the difference adds up over time and dividends make a big difference over a twenty year period. The chart shows performance for the S&P 500 (black) and the total return S&P 500 SPDR (SPY) over the last twenty years. SPY is up 220% with dividends and the S&P 500 is up 124% without dividends. The Compound Annual Return for the S&P 500 is around 4% and the Compound Annual Return for the S&P 500 SPDR is around 6%, which is a big difference.

The Moving Average Sweet Spot
The next tests will use the S&P 500, the 20-day SMA and the 200-day SMA for signals. The S&P 500 generates the signals and the trades are taken using SPY. The S&P 500 is used for signals because it is the most widely followed benchmark for US stocks. SPY is the tradable instrument. I chose the 20-day SMA as the fast moving average because it offers a sweet spot of sorts. It is faster than the 50-day SMA and will generate quicker signals. It is slower than the 5-day SMA and will have fewer whipsaws. The chart below shows an example.

The table below shows results for a long-only system and a long-short system. Buy/Cover SPY when the 20-day SMA for the S&P 500 moves above the 200-day SMA. Sell/Short when the 20-day SMA for the S&P 500 moves below the 200-day SMA. The long-only system performed quite well with a 7.4% Compound Annual Return, a 17.3% Maximum Drawdown and a 71% Win%.
 Results deteriorated when short positions were added to the system. The Compound Annual Return was less (7%), the Maximum Drawdown was above 30% and the Win% dropped below 50%. Thus, a bearish moving average crossover does not work very well for short signals.
Conclusions (adjusting exposure)
A basic moving average system using the S&P 500 can help investors adjust their exposure to the stock market. As the results above show, upside crosses can lead to sizable gains, but downside crosses do not always lead to sizable declines. Nevertheless, using a moving average crossover system for the S&P 500 can help investors gauge broad market risk (prevent big drawdowns). In their Charles Dow award winning paper, Leverage for the Long Run, Charlie Bilello and Michael Gayed note that investors can manage risk by using the S&P 500 and the 200-day SMA. Basically, they argue that investors should take more risk when the S&P 500 is above its 200-day and less risk (cash) when the S&P 500 is below its 200-day SMA. While a break below the 200-day SMA may not lead to a bear market, it does signal a period of above-average risk and rising volatility. Invest accordingly!

Plan Your Trade and Trade Your Plan.
- Arthur Hill, CMT
Senior Technical Analyst, StockCharts.com
Book: Define the Trend and Trade the Trend
Twitter: Follow @ArthurHill
