Art's Charts March 29, 2019 at 10:28 AM

S&P 500 Stalls within Uptrend. Upswing Dominates Weekly SPX Chart. Index Breadth Table Remains Bullish. IJR: Failure at 200-day or Mere Correction? Sector Table - Staples Get a Lift. XLI Hits Make-or-break Zone. UTX Consolidates around the 200-day. MMM Consolidates above 200-day... Read More
Art's Charts March 27, 2019 at 06:13 AM
S&P 500 Holds as Russell Rolls Over. Plenty of New Highs in $SPX. ChartList Updates - 3 Additions... Read More
Art's Charts March 25, 2019 at 06:21 AM
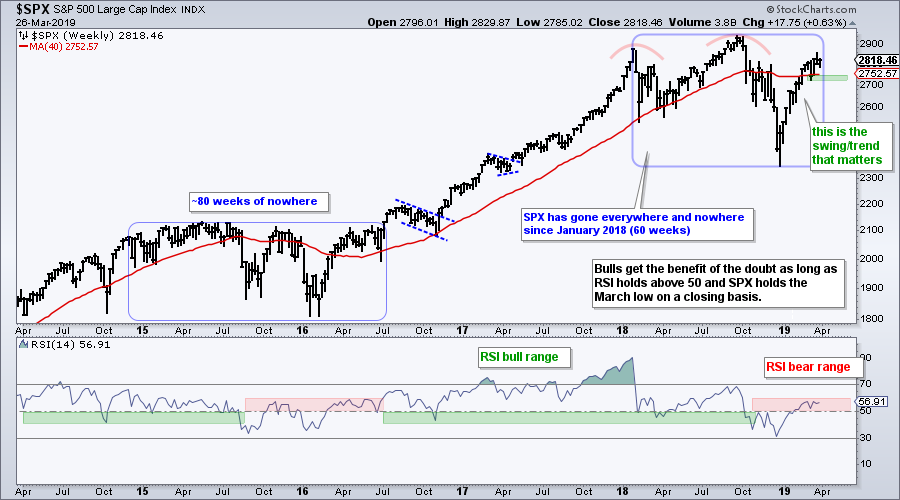
RSI Holds Bear Range for S&P 500 A Classical Reversal Area for Russell 2000 Small-cap Breadth Indicators Flip Selling Pressure in Key Groups ChartList Updates RSI Holds Bear Range for S&P 500 The S&P 500 remains above its slightly rising 40-week SMA, but this key benchmark has go... Read More
Art's Charts March 22, 2019 at 10:06 AM

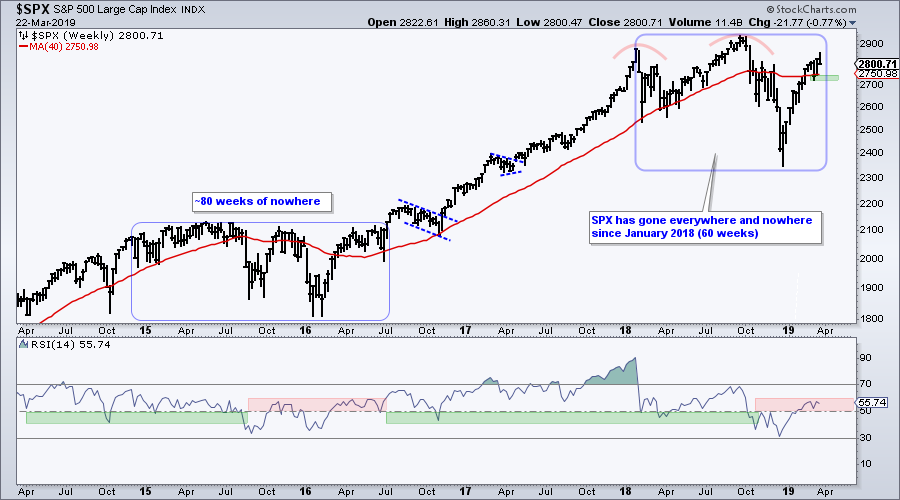
Bigger Downtrends or Simply Resting? Bank ETFs Fail at 200-day SMAs. Small-cap Indexes Fail near Retracements. Oil Nears Potential Reversal Zone. Focus on the True Leaders. S&P 500 Maintains Uptrend. Index Breadth Table Remains Bullish. Sector Breadth Table is More Mixed... Read More
Art's Charts March 21, 2019 at 08:59 AM
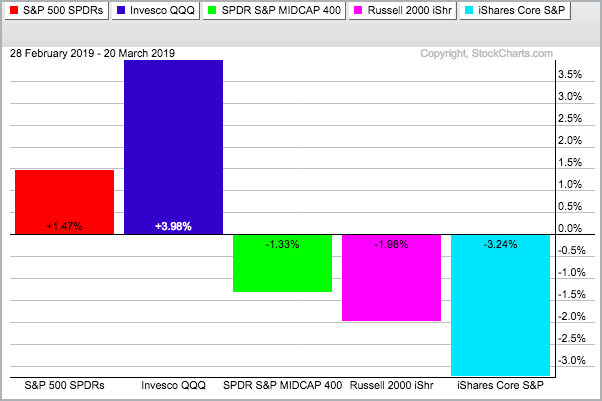
The Russell 2000 iShares (IWM) is not only lagging the S&P 500 SPDR (SPY) and the Nasdaq 100 ETF (QQQ) in March, but it is also under selling pressure and down month-to-date... Read More
Art's Charts March 20, 2019 at 11:50 AM
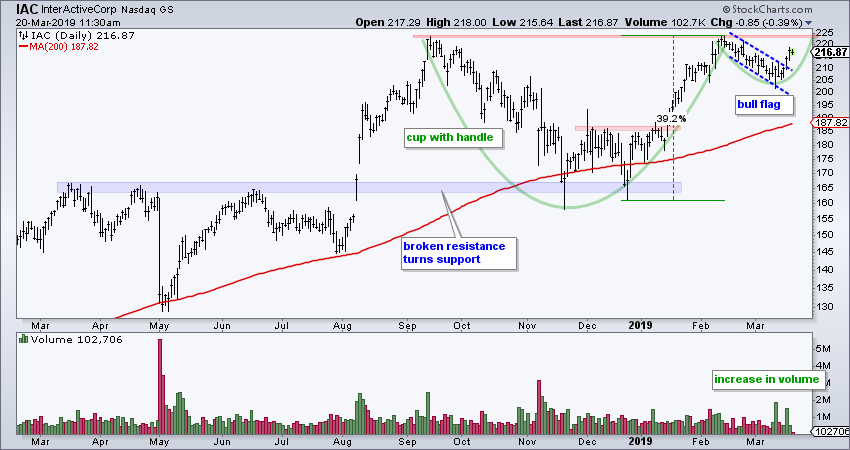
There are often smaller patterns within larger patterns and traders can get a jump on a bigger breakout by acting on the smaller pattern first. For example, a cup-with-handle is a bullish continuation pattern that typically forms over a few months... Read More
Art's Charts March 15, 2019 at 10:37 AM

20-day Holds above 200-day for S&P 500 Weekly RSI Holds above 50. Large-caps Lead Index Breadth. Tech, Utilities and REITs Lead Sector Breadth. The Dreaded Shakeout (VRTX). Consider Position Sizing (SCWX). Consider Profit Targets (PYPL). ChartList Updates. ..... Read More
Art's Charts March 08, 2019 at 10:21 AM

The First Pullback of the Year. A Big Drawn-out Range. Index Breadth Table Update. Sector Table Update. Finance Fails below November High. Retail and Banks Get Pummeled. A Bullish Continuation for Bonds. ChartList Updates. ... The First Pullback of the Year ..... Read More
Art's Charts March 06, 2019 at 08:14 AM
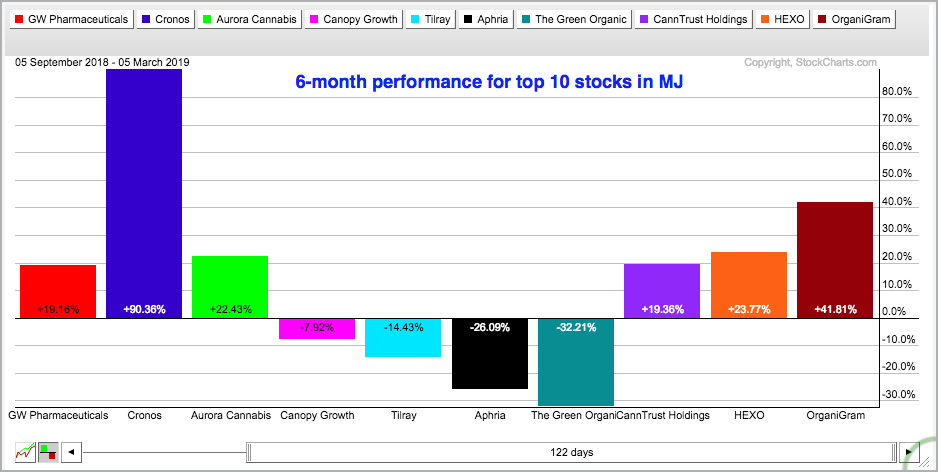
Sorry, I could not resist that title. Today's commentary will focus on the Alternative Harvest ETF (MJ) and six of its components. I am sure there are other cannabis-related names out there, but I would like to focus on the purer plays... Read More
Art's Charts March 01, 2019 at 11:00 AM

Resistance in an Uptrend? Bulk of the Evidence Bullish. Utilities, REITs and Industrials Lead in Price. Finance Holds Flag Breakout. When Bad News is Good (SQ). Volume Picks up in Fox Factory. A Classic Breakout and Throwback (SCWX). ChartList Updates. ..... Read More