Art's Charts February 27, 2019 at 08:28 AM

Apple, Amazon and Alphabet account for around 9 percent of the S&P 500 SPDR and around 27 percent of the Nasdaq 100 ETF. Thus, the next directional move in these three will clearly impact the broader market... Read More
Art's Charts February 26, 2019 at 05:39 AM

Another Obvious Resistance Level If the S&P 500 declines from current levels, we will be able to look back at this level and see it as an "obvious" resistance level. Ain't hindsight great! Keep in mind, however, that this is the third "obvious" resistance level this year... Read More
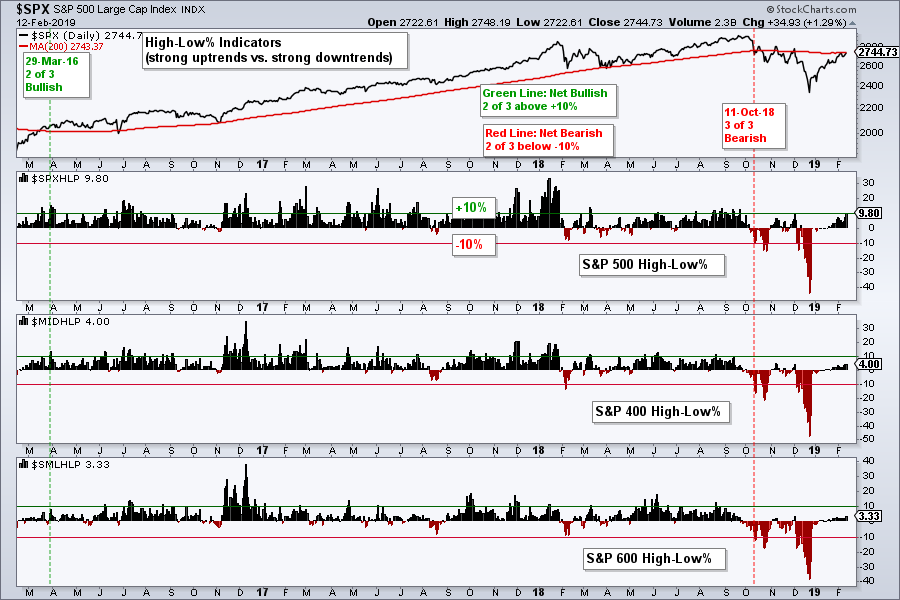
Art's Charts February 23, 2019 at 05:22 AM

The 200-day moving average is perhaps the most widely used moving average and the S&P 500 is the most widely followed benchmark for the U.S. stock market... Read More
Art's Charts February 22, 2019 at 09:39 AM

Mid-caps and Small-caps Join Large-caps. Breadth Tables Improve. XLU Shows Strongest Breadth. Changing My Mindset. Home Construction iShares Clears 200-day. Three Flags at Different Breakout Stages. Pfizer Gets Second Breakout. Berry Plastics Completes Big Reversal... Read More
Art's Charts February 20, 2019 at 06:28 AM
Six of Nine Breadth Indicators Bullish. November 2015 All Over Again? JP Morgan, Bank of America and Citigroup Break Out. A Successful Test for Disney. ChartList Addition and Deletion. On Trend on YouTube... Read More
Art's Charts February 17, 2019 at 08:45 AM
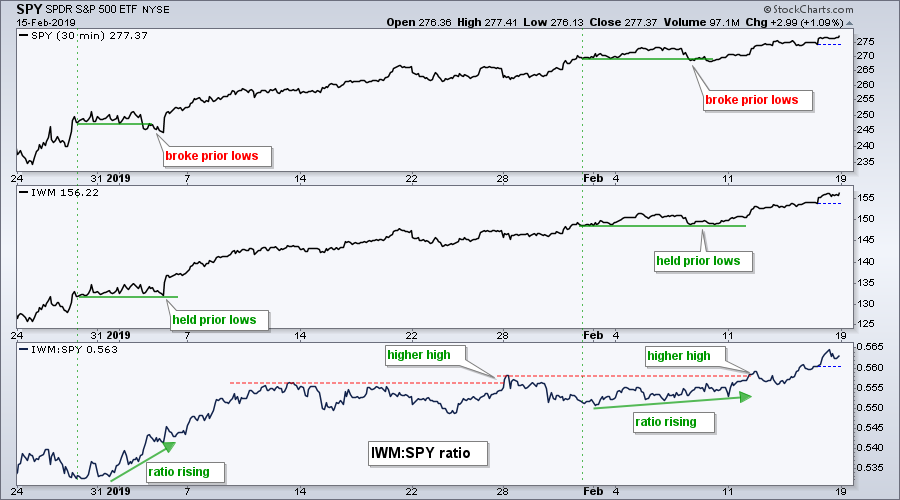
Chartists can compare two price plots to find early signs of relative strength. This can be done by comparing the corresponding peaks or troughs for two names, such as the Russell 2000 iShares (IWM) and the S&P 500 SPDR (SPY)... Read More
Art's Charts February 15, 2019 at 10:58 AM

Reviewing the Weight of the Evidence New Highs Expand in XLK Sector Table is Net Bullish (XLK, XLV, XLI Lead) What If December-January Never Happened? Four Consolidations to Watch (XLF, IAI, XRT, IBB) New Additions to the ChartList AMD Keeps Flag Alive Finisar Holds Breakout Intu... Read More
Art's Charts February 14, 2019 at 09:29 AM

Chinese stocks came to life after their New Year's holiday with the Shanghai Composite ($SSEC) and some ETFs breaking double bottom resistance. Before looking at these charts, let's review the double bottom, which is a bullish reversal pattern... Read More
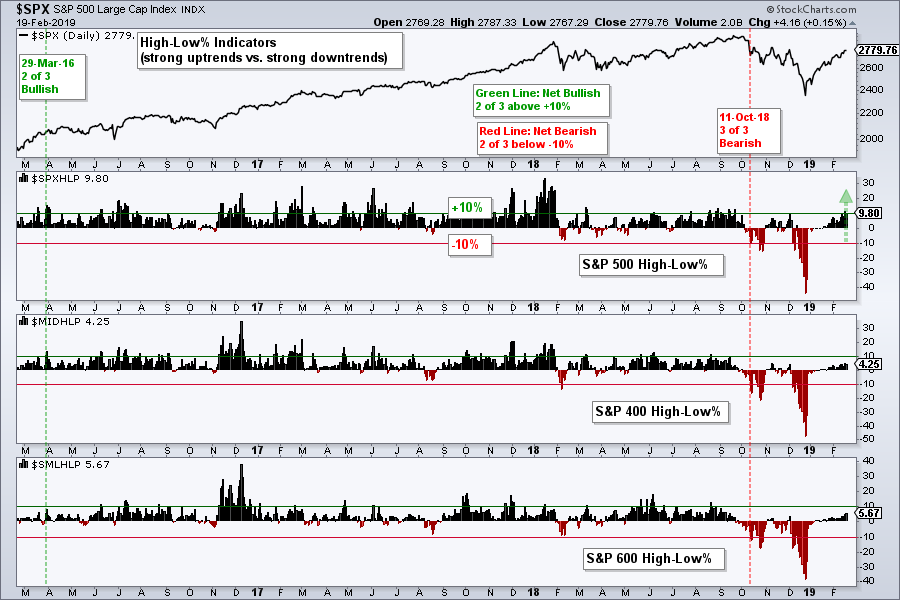
Art's Charts February 13, 2019 at 04:57 AM
SPX High-Low Percent Nears Signal Flip. Intuitive Surgical Breaks Out. Walgreens-Boots Bounces off 200-day. Careful with AMD. RSI Improvements in Intel. ... Five of the nine breadth indicators are on bearish signals right now, but S&P 500 High-Low% ($SPXHLP) reached 9... Read More
Art's Charts February 11, 2019 at 08:15 AM
... The stock market took a rest last week as the S&P 500 stalled in the 2708 area, which is just below the 200-day SMA. Note that the S&P 500 rose 24 of the last 31 days and gained around 15% in six weeks... Read More
Art's Charts February 08, 2019 at 09:35 AM

Breadth Indicators Fall Short. S&P 500 Backs off the 40 Week. When to Tread Carefully. Offensive Sectors Weigh. Sector with Lowest Correlation to $SPX. Utes Lead the Market. Bond ETFs Consolidate within Uptrends. ChartList Notes, Additions and Deletions. ..... Read More
Art's Charts February 07, 2019 at 10:07 AM
XLF Goes from Leader to Laggard. XLF Hits Resistance and Retracement. Bollinger Band Squeeze Chart. Bollinger Band Squeeze Scan Code. On Trend on StockChartsTV ...XLF Goes from Leader to Laggard ..... Read More
Art's Charts February 06, 2019 at 05:30 AM
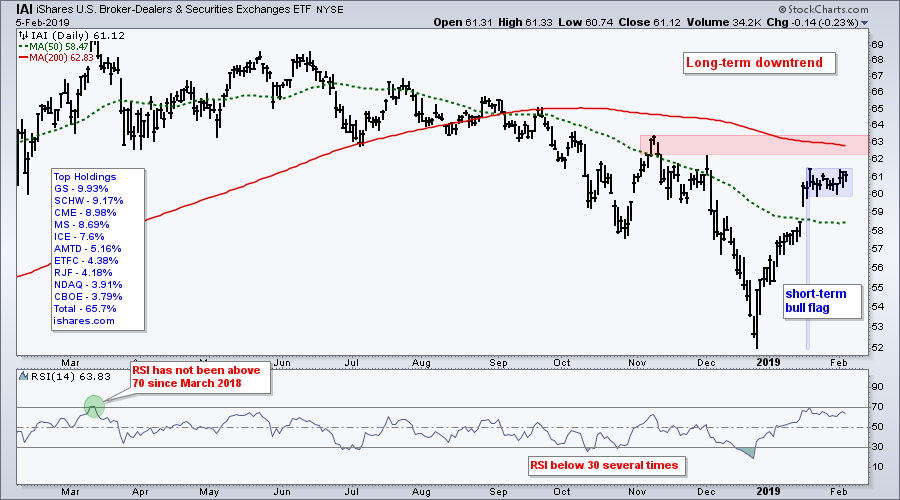
The Broker-Dealer iShares (IAI) led the market rebound from December 24th to January 18th and then stalled out over the last two weeks. As with the broader market, we can see two conflicting trends... Read More
Art's Charts February 04, 2019 at 08:14 AM

Extended but Not Overbought. SPY and QQQ Form Doji. %Above 20-day EMA Holds Strong. 4 Sector SPDRs above their 200-day SMAs. On Trend on StockChartsTV. ..... Read More
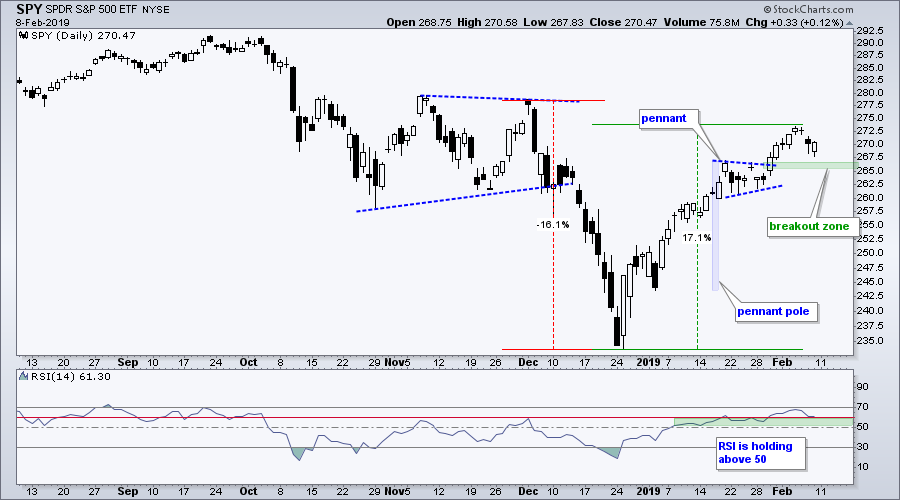
Art's Charts February 01, 2019 at 11:37 AM

Putting January Into Perspective. Still Below December High. Another Reversal Zone Appears. SPY and the Pennant Breakout. Participation begins the Wane. REITs, Utes and Healthcare Lead New Highs. XLU Extends on Breakout. Charts that Make me Throw my Hands Up... Read More