- Cup-with-handle Taking Shape in IWM.
- Bond ETFs Reach Potential Reversal Zone.
- Art's Charts ChartList Update (SMTC added).
Art's Charts featured IWM on Monday with a bullish chart and a lagging price. Even though IWM remains well below its September highs, the ETF broke out of a falling flag pattern in early April and this breakout was largely holding. Tuesday's surge off the breakout zone affirms support in the 154-155 level. A close below 154 would call for a re-evaluation.
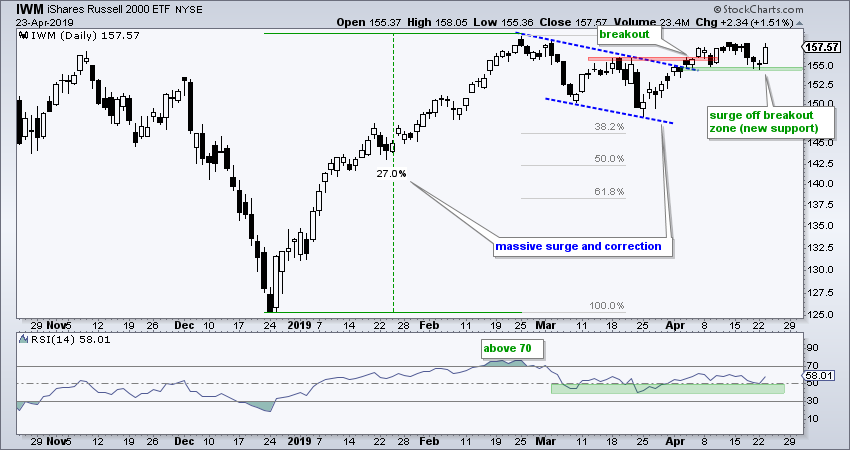
Cup-with-handle Taking Shape
The cup-with-handle pattern and follow through day were popularized by William O'Neil of IBD and these to concepts can be applied to the IWM chart. According to O'Neil, the cup-with-handle is a bullish continuation pattern that forms after an advance and the pattern extends at least seven weeks.
IWM surged around 25% from late December to late February and the cup-with-handle extends the last eight weeks. This pattern represents a consolidation after an advance and sets the stage for another leg higher. Tuesday's surge near the 200-day SMA is encouraging, but we need to see follow through and a break above rim resistance to confirm the pattern (call it a close above 160).

The indicator window shows RSI(14) with three ranges over the past year (bull, bear and bull). The bull range extends from 40 to 80 and the bear range extends from 20 to 60. RSI has been in its bull range since mid January. A move below 40 would break this range and call for a re-assessment of the bigger uptrend on the price chart.
Bond ETFs Reach Potential Reversal Zone
The 7-10 YR T-Bond ETF (IEF) and the 20+ YR T-Bond ETF (TLT) surged in March and fell back in April. As with any decline, we need to put it into perspective. Is this decline of a bigger downtrend or is it a correction within a bigger uptrend? I suggest the latter.
IEF broke out of a consolidation in March and remains well above its rising 200-day SMA. Thus, the long-term trend is up. A pullback after a big advance is normal and IEF reached a potential reversal zone. Notice that broken resistance turns support in the 104.7 area (blue zone) and the April decline retraced 50-61.8% of the March advance. We could also draw a falling wedge, but I do not think this is necessary. IEF firmed the last three days and a breakout at 105.5 would provide the first sign of an upturn.

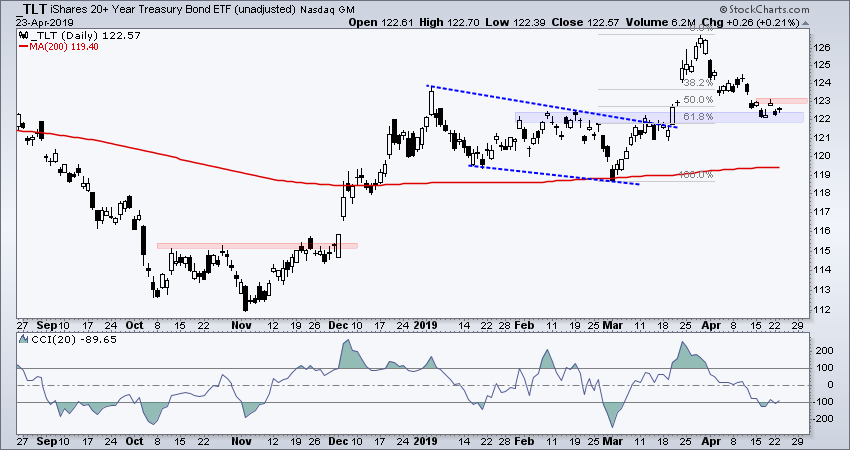
I can hear the questions already! But Art, how can TLT and IWM both have bullish setups? Shouldn't stocks move down when bonds move up? Maybe, maybe not. Personally, I do not want to over extrapolate relationships between to asset classes, especially intermarket relationships. While gold and the Dollar have a clear relationship, the other relationships are much more fickle and I prefer to look at the individual charts for direct assessments
Art's Charts ChartList Update
There are a lot of surge, consolidation and continuation patterns out there right now. Basically, we saw stocks surge in January-February, consolidate in March and start moving higher in April. The chart below shows Semtech (SMTC) breaking out of a big wedge in February, correcting into March and turning up in April with a flag breakout. The stock is above the rising 200-day and RSI is in its bull range. I will add this stock to the Art's Charts ChartList.
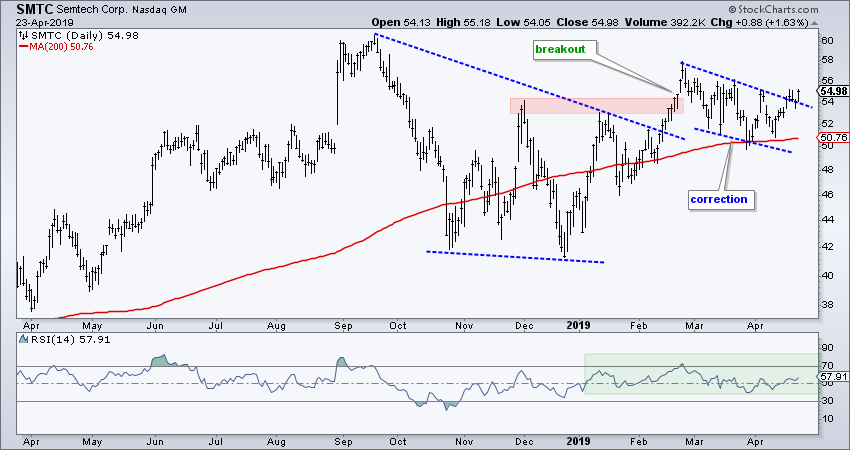
ChartList Changes
24-Apr: ISRG set for removal (closed below re-evaluation level)
24-Apr: SMTC set for addition
On Trend on Youtube (Tuesday, 23-April)
- Five Big Sectors Lead in 2019
- IWM Hits Moment-of-truth for Breakout
- FAANG Stocks are Not Dead
- ETF Breakouts (PPA, TAN, XES)
- Bond ETFs Reaches Potential Reversal Zone
- Stocks to Watch (CRON, AMAT, SCWX...)
- Click here to Watch
Arthur Hill, CMT
Senior Technical Analyst, StockCharts.com
Author, Define the Trend and Trade the Trend
Want to stay up to date with the latest market insights from Arthur?
– Follow @ArthurHill on Twitter
– Subscribe to Art's Charts
– Watch On Trend on StockCharts TV (Tuesdays / Thursdays at 10:30am ET)
