- Small-caps Continue to Lag.
- S&P 500 Nears All Time High.
- IWM Tests Breakout Zone.
- Index Breadth Table Update.
- Industrials and Finance Come to Life.
- Art's Charts ChartList Update.
Back in the Saddle
After a vacation and market hiatus, today's commentary will review the broader market and some recent happenings in the sectors. I also updated the Art's Charts ChartList, which was hit with weakness in healthcare stocks.
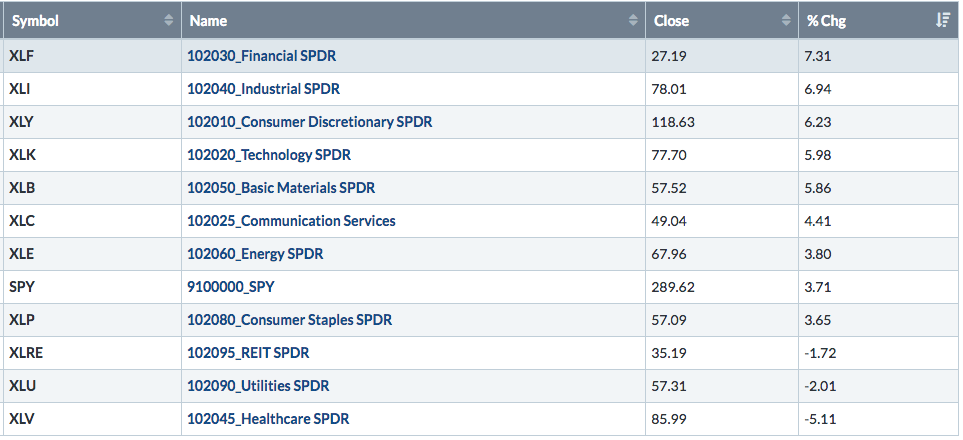
The bulk of the evidence remains bullish, but there some negative crosscurrents remain. Small-caps, in particular, are not keeping pace with large-caps. However, large-caps still dominate the stock market and the bulk of the evidence for the S&P 500 remains bullish. The Technology SPDR (XLK) and Consumer Discretionary SPDR (XLY) continue to lead overall with new highs last week. The Industrials SPDR (XLI) and Financials SPDR (XLF) came to life and are leading the 11 sectors over the past month. The Health Care SPDR (XLV), which is the second largest sector in the S&P 500, was hit hard and is now a laggard. The Energy SPDR (XLE) remains the weakest sector overall.
Small-caps Continue to Lag
April has been good for stocks so far, but small-caps continue to lag overall. The S&P 500 and S&P Small-Cap 600 are up around 2.5% month-to-date. However, the S&P 500 is within 2% of a 52-week high and the S&P Small-Cap 600 still around 15% from its 52-week high, which was recorded way back in August. The Nasdaq 100 remains the leader with a 4% gain so far in April. In addition, the index hit a new high intraday last week.

S&P 500 Nears All Time High
The S&P 500 remains my "go to" index for the state of the stock market and the bulk of the evidence is still bullish. This evidence turned bullish in mid February and the 20-day SMA crossed above the 200-day SMA in late February. RSI also exceeded 70 in the second half of February and remains in its bull zone (40 to 80).
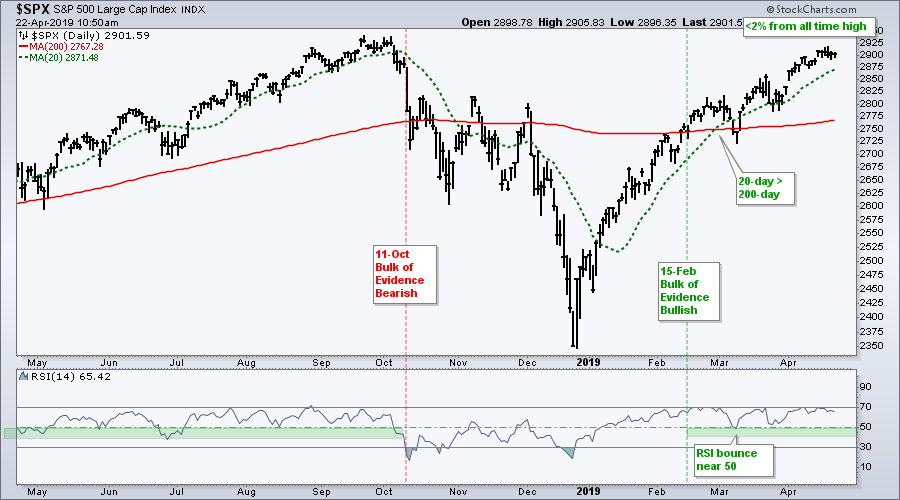
Why use the 20-day SMA and 200-day SMA? Check out this article and video from February 2019 (here). I put various moving average combinations to the test and settled on the 20/200 combo for the S&P 500.
IWM Tests Breakout Zone
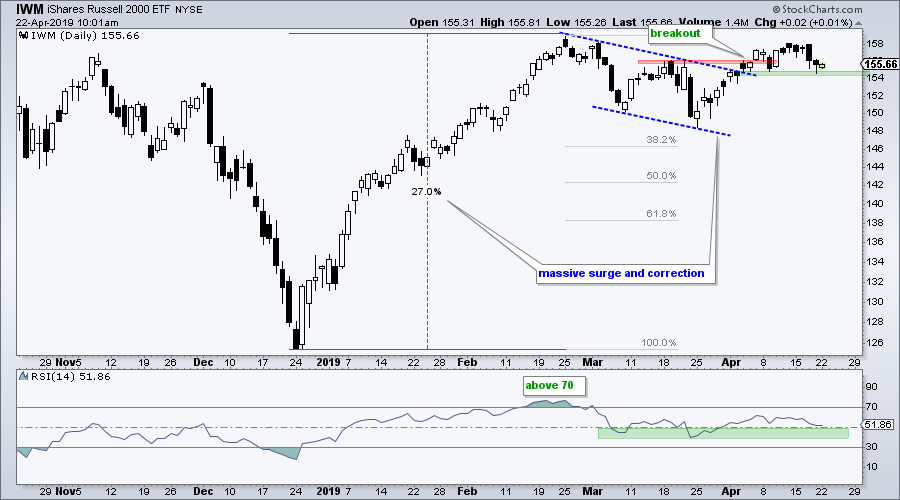
Even though small-caps are lagging, the daily candlestick chart for the Russell 2000 iShares (IWM) remains bullish overall. The ETF surged 27% from late December to late February and then corrected with a falling flag of sorts. IWM broke out of this pattern in early April and this breakout is largely holding. A close below 154 would negate the breakout and call for a re-evaluation.
Index Breadth Table Update
The majority of breadth indicators for the indexes remain bullish (six of nine). All three indicators are on bullish signals for the S&P 500, two of three are on bullish signals for the S&P Mid-Cap 400 and two of three are on bearish signals for the S&P Small-Cap 600. In particular, the High-Low Percent indicators are dragging their feet for small-caps and mid-caps because these two groups are not producing new highs. Even though this is a concern, I will not turn bearish until the majority of indicators have active bearish signals. You can learn more about these indicators in this Art's Charts article and video.
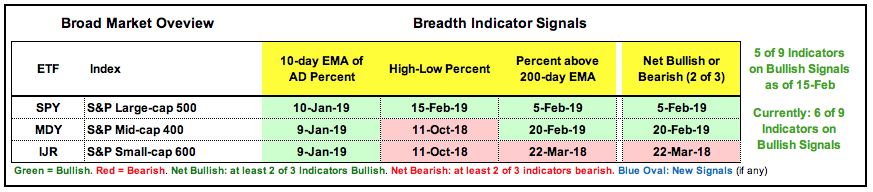
Advance-Decline Percent: Bullish and Bearish Breadth Thrusts

Percent Above 200-day EMA: Percentage of uptrends
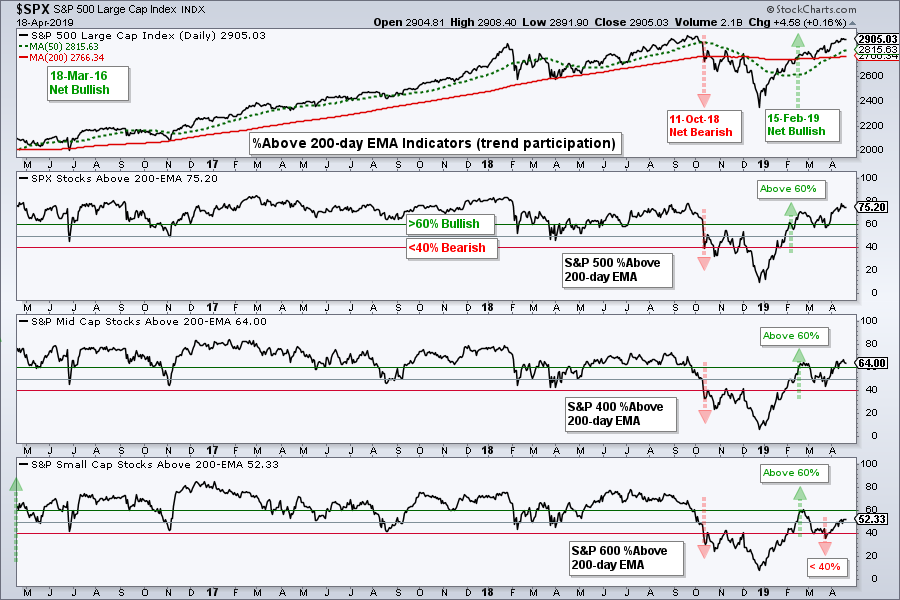
High-Low Percent: Percentage of very strong uptrends and leading stocks

Sector Table Remains Bullish
The next table shows these same indicators applied to the 11 sector SPDRs and there were four changes since the last update. Overall, the table is overwhelmingly bullish with 10 of 11 sectors net bullish and 28 of the 33 indicators on bullish signals. The 10-day EMA of AD Percent triggered bearish for the Health Care SPDR with a plunge below -30% and bullish for the Industrials SPDR with a surge above +30%. On the bullish side, the %Above 200-day EMA indicators for the Financials SPDR and Communication Services SPDR moved above 60% to trigger bullish signals. All three indicators for the finance sectors are bullish and this is positive for the market overall.

Art's Charts ChartList Update
There are/were five stocks in the healthcare sector on the Art's Charts ChartList at the end of March and all five were hit with selling pressure in April. I am removing Merck, Eli Lilly and Vertex. XLV is the worst performing sector over the three and six month timeframes, as well as year-to-date. Even though XLV and these stocks look ripe for an oversold bounce, I do not want to be overweight in a lagging sector and will make some cuts. Click here for the Art's Charts ChartList.
22-Apr: MRK set for removal
22-Apr: LLY set for removal
22-Apr: VRTX set for removal
Arthur Hill, CMT
Senior Technical Analyst, StockCharts.com
Author, Define the Trend and Trade the Trend
Want to stay up to date with the latest market insights from Arthur?
– Follow @ArthurHill on Twitter
– Subscribe to Art's Charts
– Watch On Trend on StockCharts TV (Tuesdays / Thursdays at 10:30am ET)
