Last weekend's post showed the Semiconductor ETF (SOXX) with a 10 day overbought streak and several ETFs with even bigger overbought streaks. These streaks came to an end this week as SOXX fell 6.21%, its biggest weekly decline since mid March. As measured by Normalized ROC, this is an outsized decline that argues for at least a corrective period over the next few weeks.
Normalized ROC is part of the TIP Indicator Edge Plugin for StockCharts ACP. This indicator is the Dollar price change divided by the Average True Range (ATR). In this example, I am using the 5-day price change (- $25.93) and dividing by 250-day ATR (6.69). -25.93 divided by 6.69 is 3.88. This means the 5-day Dollar decline was 3.88 ATR(250) values, or almost a 4 ATR decline, which is quite large. An advance or decline that exceeds 3 ATR values is considered an outsized move. This same principle is applied to Keltner Channels to look for trend reversals.
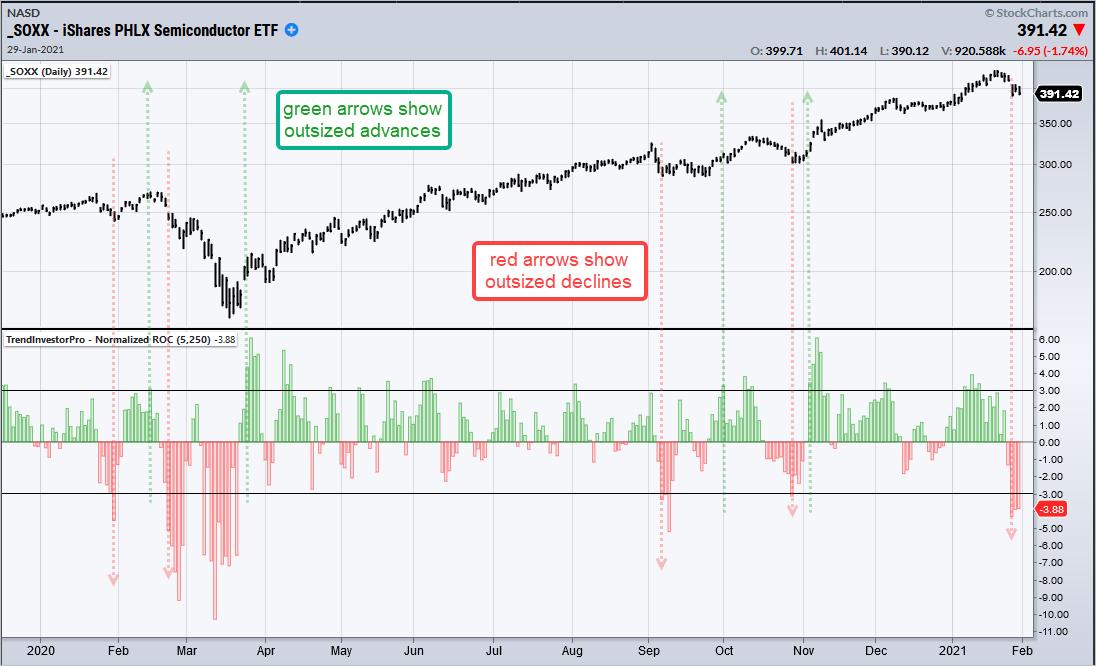
An outsized move signals a sudden and dramatic shift, but also presents traders with a double-edged sword. Short-term (one week), the outsized decline creates an oversold condition that could give way to a bounce. Medium-term (one month), the outsized decline shows abnormal selling pressure that could lead to further weakness or a corrective period. The chart below shows initial outsized moves in green (up) and red (down). An outsized advance in early November kicked off a surge to new highs and the outsized decline here in late January could signal the beginning of a correction. Look for an outsized advance to counter this latest signal.
Note that outsized moves are just one piece of the puzzle. Chartists need to consider other pieces and that's just what we do at TrendInvestorPro. Many ETFs are short-term oversold and the turn of the month has a strong bullish bias, which has been quantified. Medium-term, we saw some bearish breadth thrusts, RSI end its overbought streak and almost 50 outsized declines this week. Click here to subscribe and get immediate access to our Market Timing Report, ETF Trends & Patterns Report and Comprehensive Weekend Video.
------------------------------------------
Choose a Strategy, Develop a Plan and Follow a Process
Arthur Hill, CMT
Chief Technical Strategist, TrendInvestorPro.com
Author, Define the Trend and Trade the Trend
Want to stay up to date with Arthur's latest market insights?
– Follow @ArthurHill on Twitter
