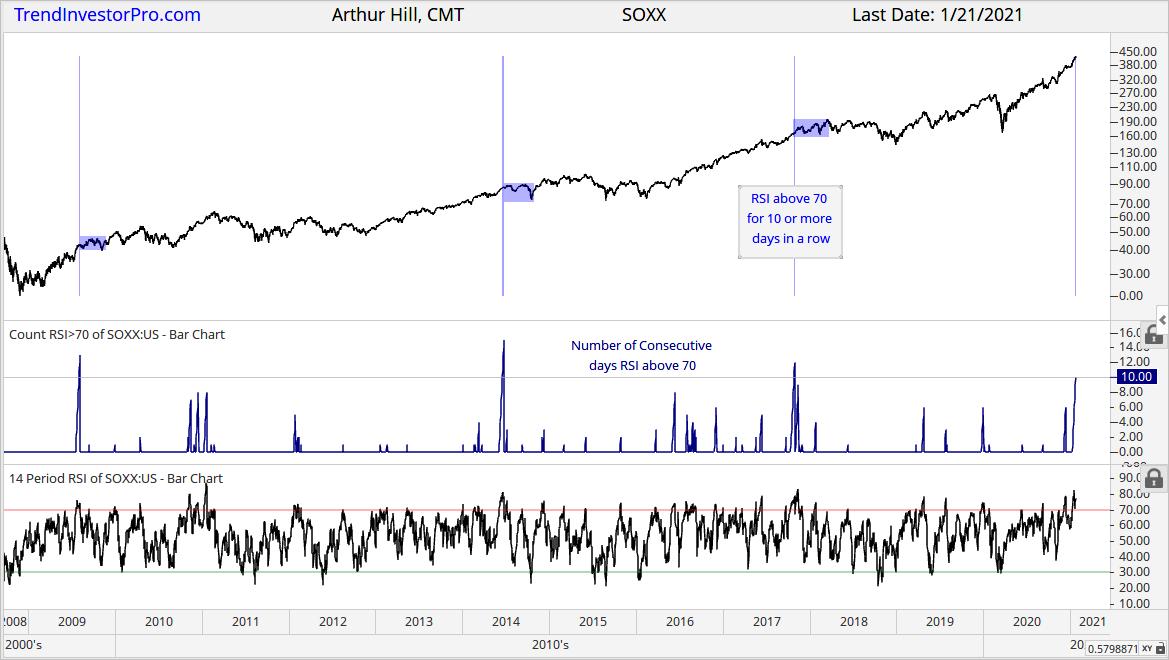
 The Semiconductor ETF (SOXX) and several other ETFs are on a serious roll in 2021. For the fourth time since 2009, 14-day RSI was above 70 for ten or more days. This is an exceptional streak, but SOXX is not alone and there are even longer streaks. The following list shows some ETFs and the number of days RSI has been above 70: ROBO (39), DRIV (25), ARKQ (13), EWT (13), MOO (12), XRT (11), SOXX (10), YOLO (10). Note that these numbers are based on Thursday's close.
The chart below shows SOXX with the last three times RSI was above 70 for 10 or more days (blue lines). Admittedly, three instances is not enough to base a strategy, but SOXX is clearly extended and ripe for a rest. The shaded rectangles on the chart show price action three to four months after each occurrence. Notice that SOXX had choppy trading each time.
The next chart shows SOXX advancing some 140% since the March low and 40% since the late October low (58 days). We do not need a momentum oscillator to figure out that SOXX is quite extended and ripe for a rest. Timing a correction or a pullback is quite a challenge because ETFs can become overbought and remain overbought, as we are seeing here in January.
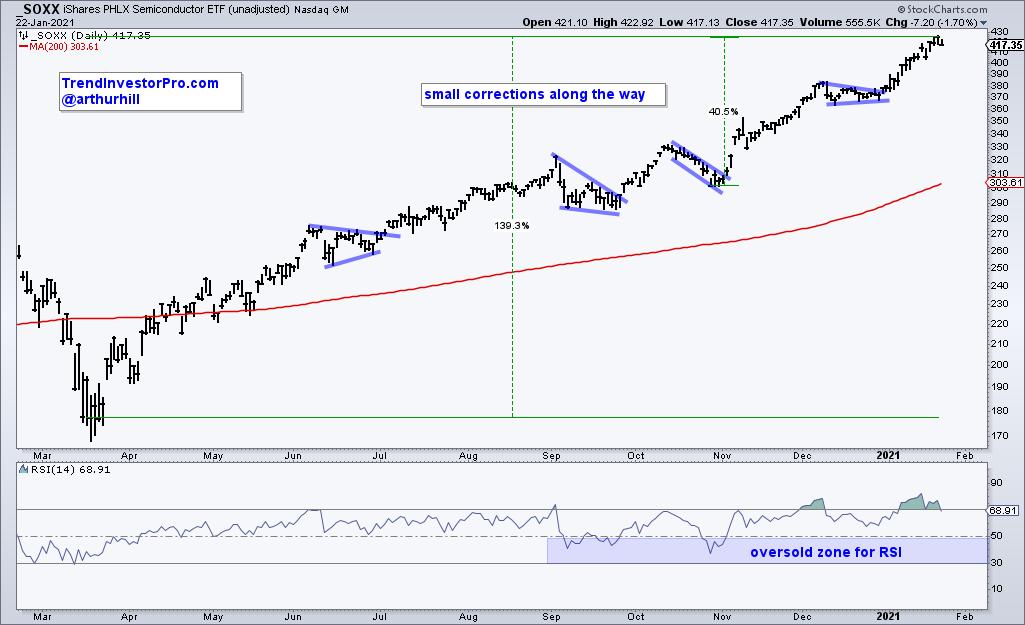
While I would not be interested in calling a top or shorting a strong group in a bull market, now does not seem like a good time to force a shot with a long position. Instead, chartists should consider exercising a little patience and waiting for a better shot (opportunity). It will come - we just don't know when, exactly. The chart shows four such opportunities during this uptrend with small corrections along the way and RSI dips into the 30-50 zone. RSI moved back below 70 on Friday and could pullback for the next setup.
TrendInvestorPro focuses on finding bullish setups and short-term oversold setups within leading uptrends. Using our core list with 117 ETFs, we rank trend strength, track trend signals and identify tradable pullbacks within uptrends in a systematic manner. Also note that Saturday video's looks at setups emerging in GLD and TLT as well as signals from XLU, XLRE and REZ this week. Click here to take your analysis to the next level!
-------------------------------------------
Choose a Strategy, Develop a Plan and Follow a Process
Arthur Hill, CMT
Chief Technical Strategist, TrendInvestorPro.com
Author, Define the Trend and Trade the Trend
Want to stay up to date with Arthur's latest market insights?
– Follow @ArthurHill on Twitter


