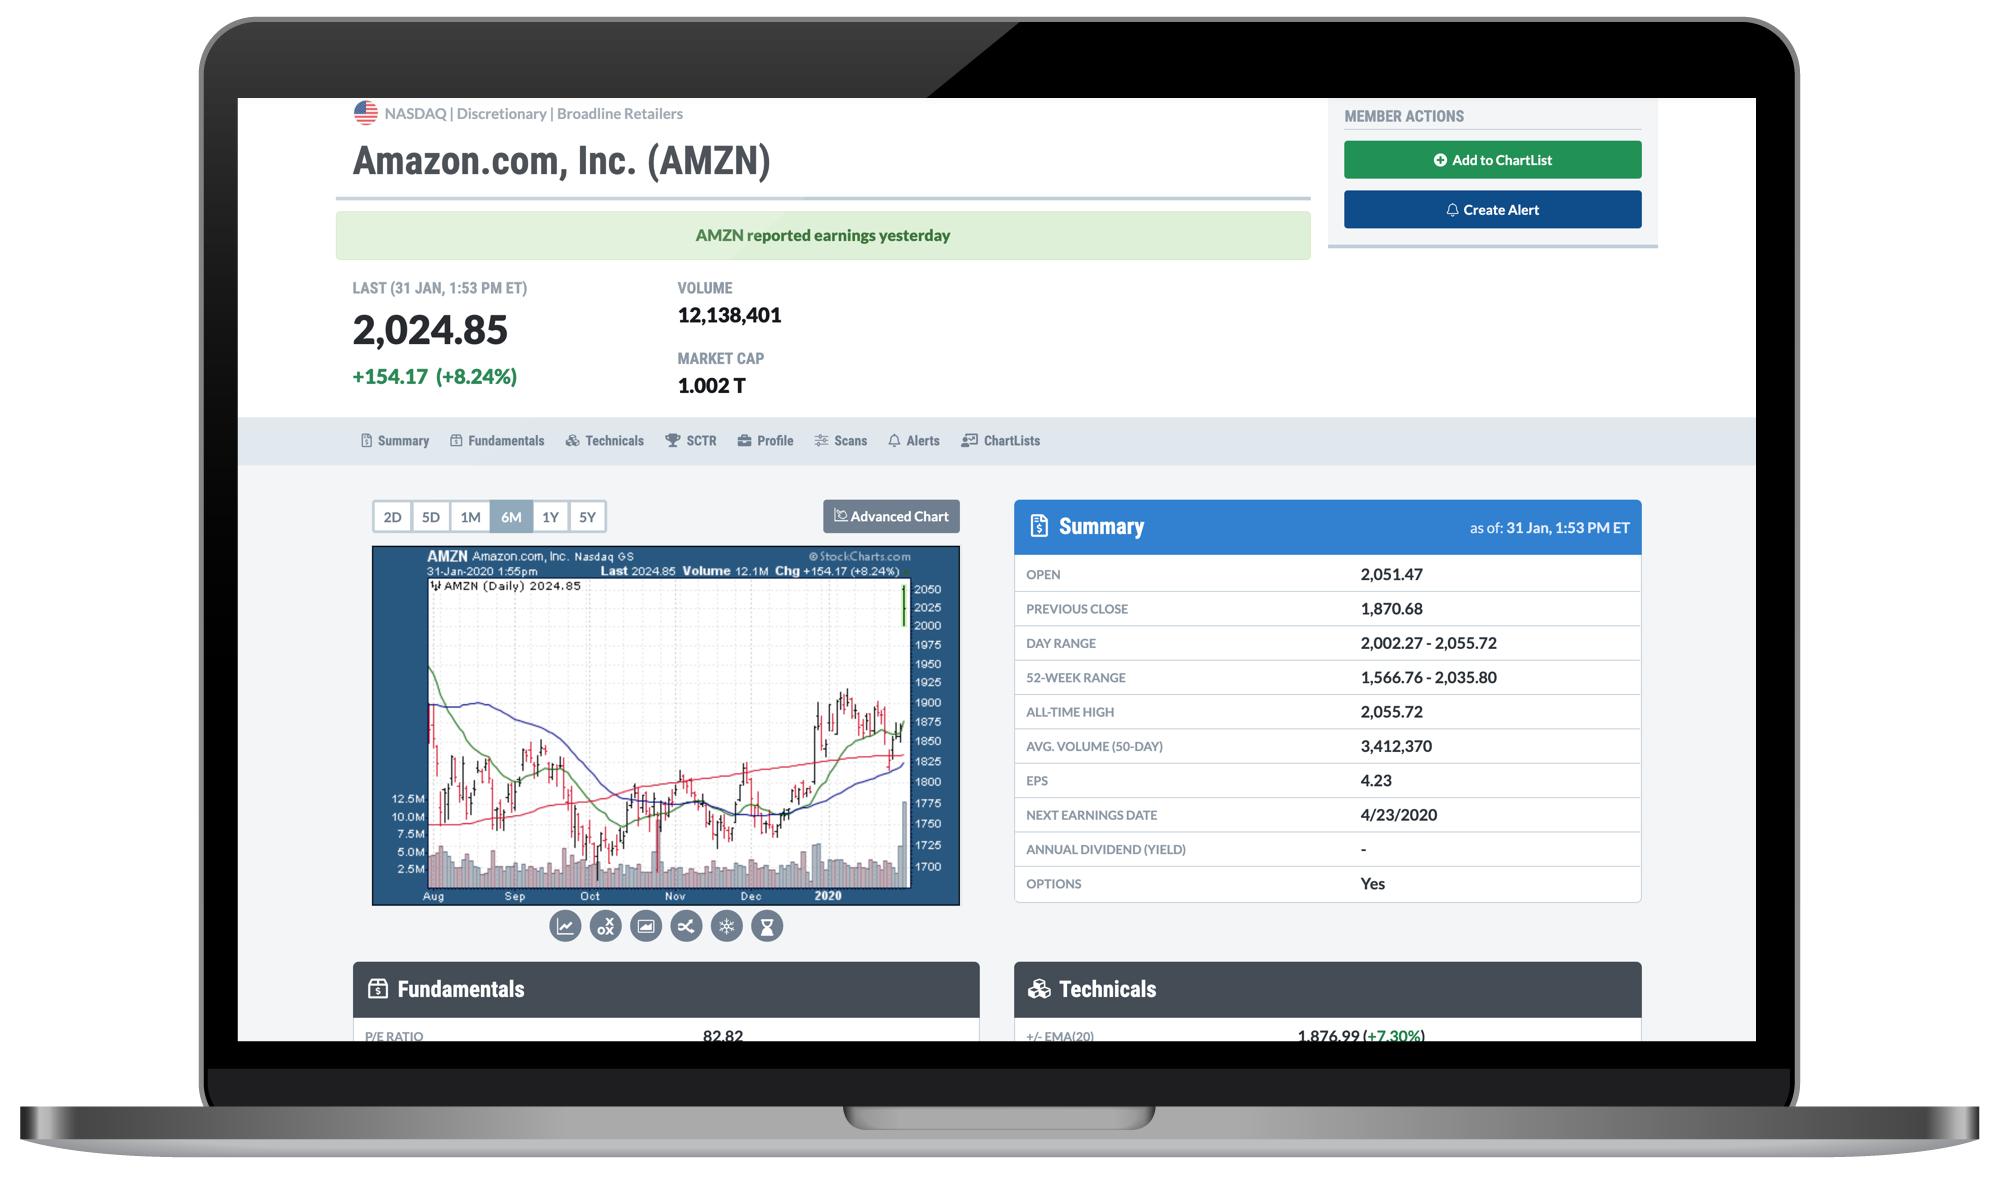
 AMZN reported earnings yesterday.
Wondering how I know that? You probably think it's because my Twitter feed was blowing up or some notification came across my screen after the close. But here's the real answer...
I know that AMZN reported earnings yesterday because I saw it on StockCharts!
That's right - earnings. On StockCharts. Now live on our brand-new "Symbol Summary" page!
This week, it is my great pleasure to announce our Symbol Summary page. Expanding upon the success of our "Full Quote" option in SharpCharts, this new resource is designed to bring you an even more extensive and complete way to analyze stocks, funds, indexes and more.
From a single page, you can now see the latest price info, view a chart in multiple timeframes, browse high-level summary stats, fundamentals and popular technicals, get earnings dates and dividend info, visualize a symbol's recent SCTR performance, read full company and ETF descriptions, and much more. With tons to explore in this dynamic resource, this just might become your new favorite StockCharts tool.
And It's Just The Beginning...
What's perhaps most exciting about this new feature is the waterfall effect that it will have. We're standing at the top of the waterfall right now, launching ourselves off the edge by introducing the first version of our Symbol Summary. Having taken the plunge, we have no choice now but to fall further down the waterfall.
That means bringing you even more fundamental data, after-hours prices, complete earnings history, analyst ratings, and more. Very soon, you'll have the ability to run scans for this data and set automatic alerts based on earnings events. You'll be able to chart key statistics like P/E, EPS, market cap and much more. You'll see full earnings history including reported vs. estimated values for previous quarters. Major additions like these are already in the works, so I'm delighted to admit that this really is only the beginning. It's the start of a significant data expansion here at StockCharts, and we're only at the "top of the waterfall" with this new Symbol Summary page. I can't wait show you what else is in store in the coming weeks and months!
So, first thing's first - here's how to access the new Symbol Summary page.
From The Navigation Bar
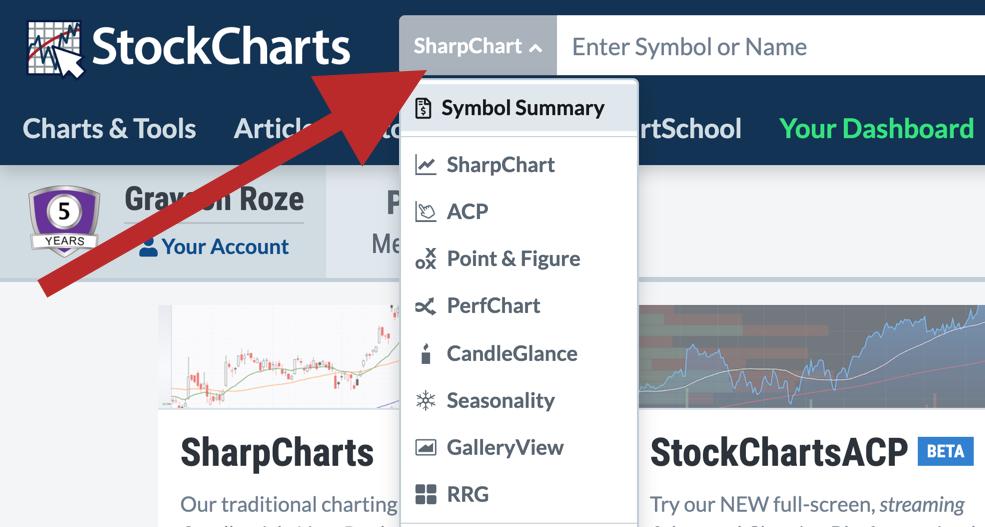
At the top of every StockCharts page, the dropdown menu to the left of the search bar will now include a "Symbol Summary" option. Click where it says "SharpChart" (the default) and then select "Symbol Summary" from the menu that appears. Enter a symbol, hit go, and you're off to the races.
As we continue to roll out support for this new tool, the navigation bar should become your go-to for accessing the new Symbol Summary page.
On Your Dashboard
From Your Dashboard, you now have a link to the Symbol Summary page in the "Member Tools" panel at the top left. Scroll down to Summary Pages and you'll see an entry for it in the list.
From The Charts & Tools Page
On the Charts & Tools page, you'll also find a card for the Symbol Summary page under "Summary Pages". Scroll down to that card and use the input box to pull up any ticker you'd like.
Now that you've found your way over to the new tool, let's jump in and take a closer look at the most important aspects of our Symbol Summary page.
Fundamentals And Technicals, Side By Side
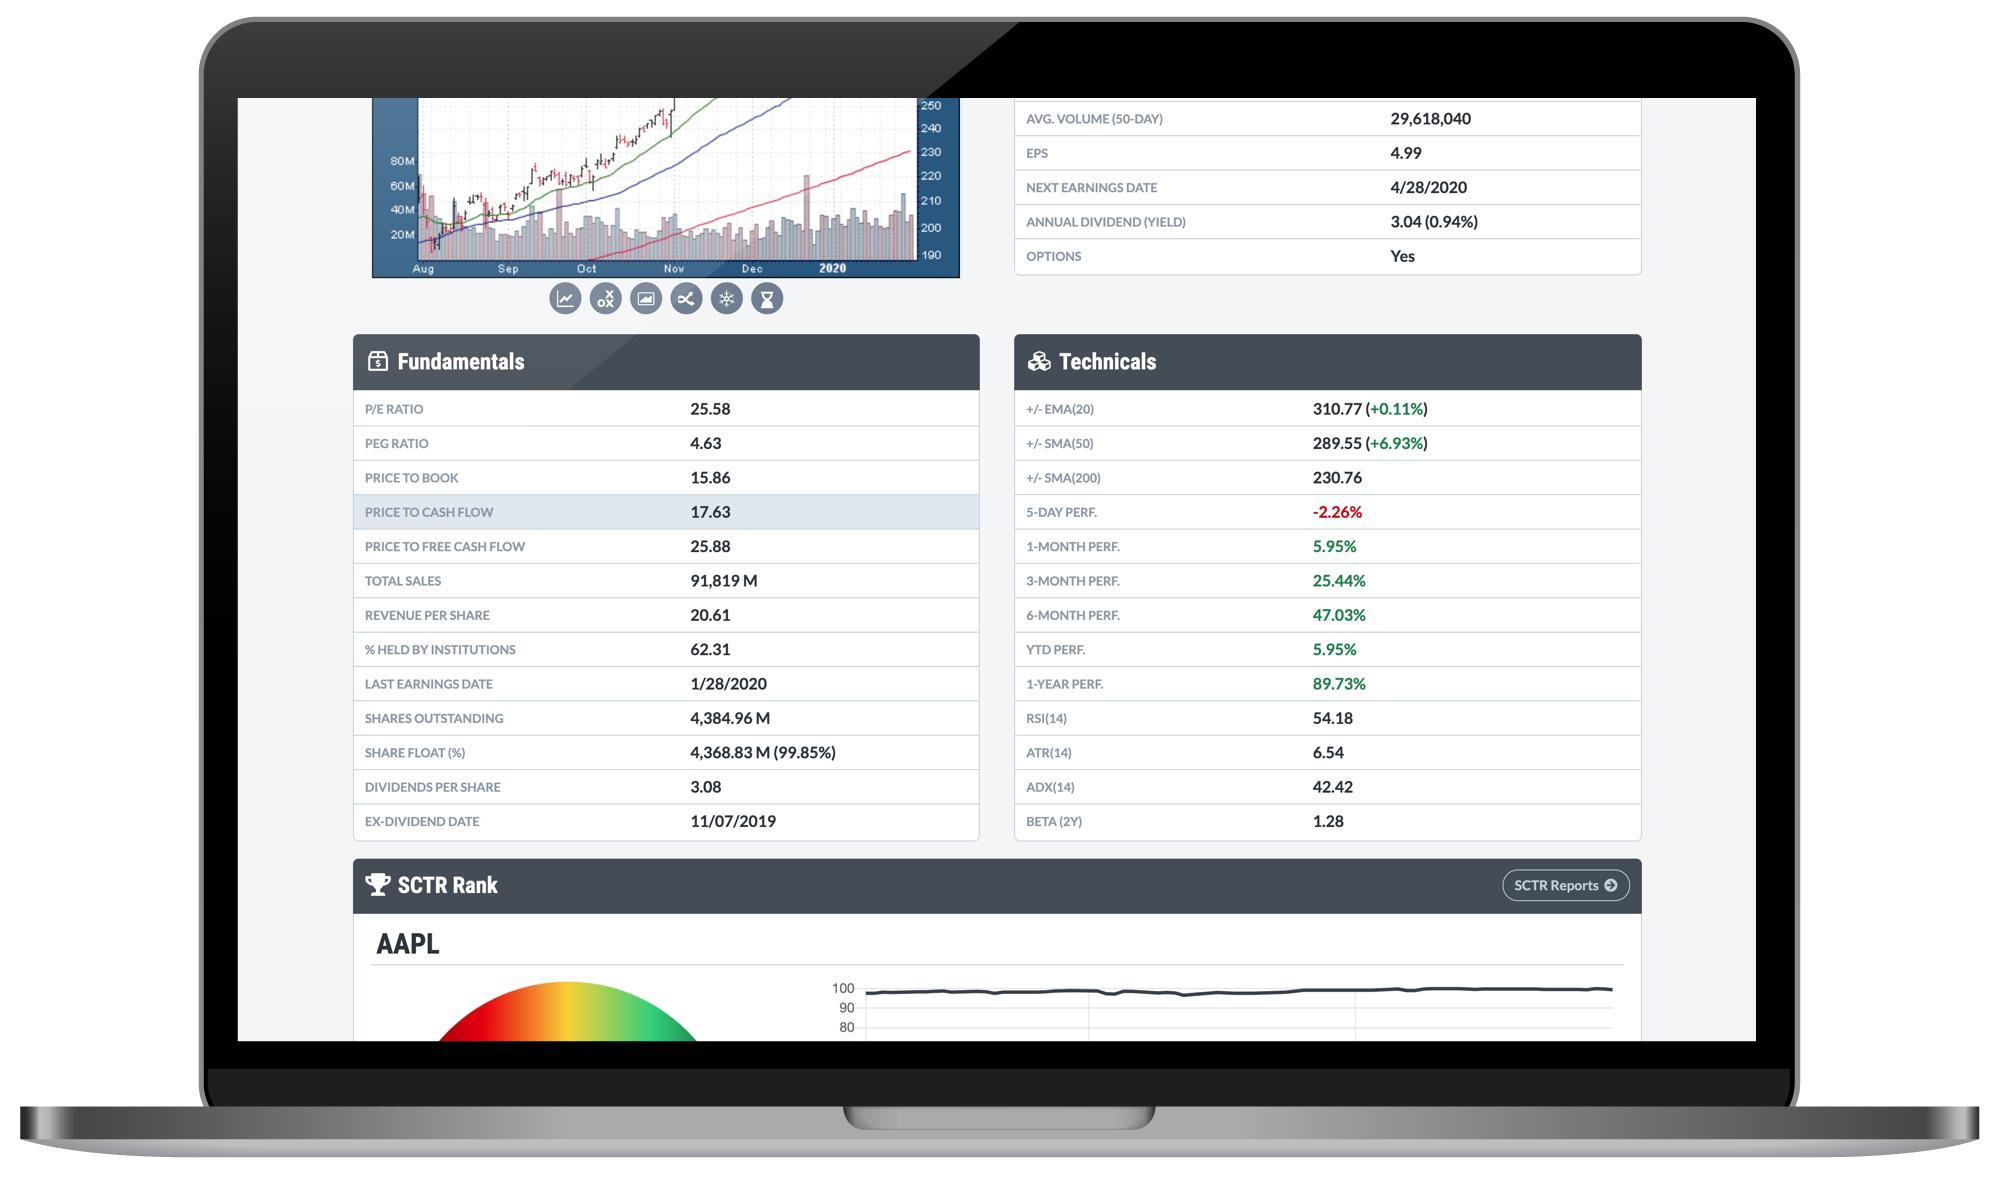
Below the price chart and Summary panel (where you'll find important price numbers, dividends, earnings dates and other key values like EPS), we have our expanded Fundamentals panel. With a ton of new data points we've never covered before on StockCharts, this is a major addition to the site that we believe will greatly enhance your analysis capabilities. You'll find crucial figures like P/E ratio, PEG ratio, Price to Book, Total Sales, Revenue per Share, Percent Held by Institutions (a favorite of mine!), Shares Outstanding, Share Float and many more.
Right next to the Fundamentals, you'll also see a Technicals panel that includes some of the crucial figures our users follow. We've added a variety of price performance numbers, helpful points like position relative to key Moving Averages, and common indicator values like RSI, ATR and ADX.
My personal favorite here – the 2-year Beta value at the bottom of the panel. Thrilled to bring that to this tool!
Unique SCTR Views
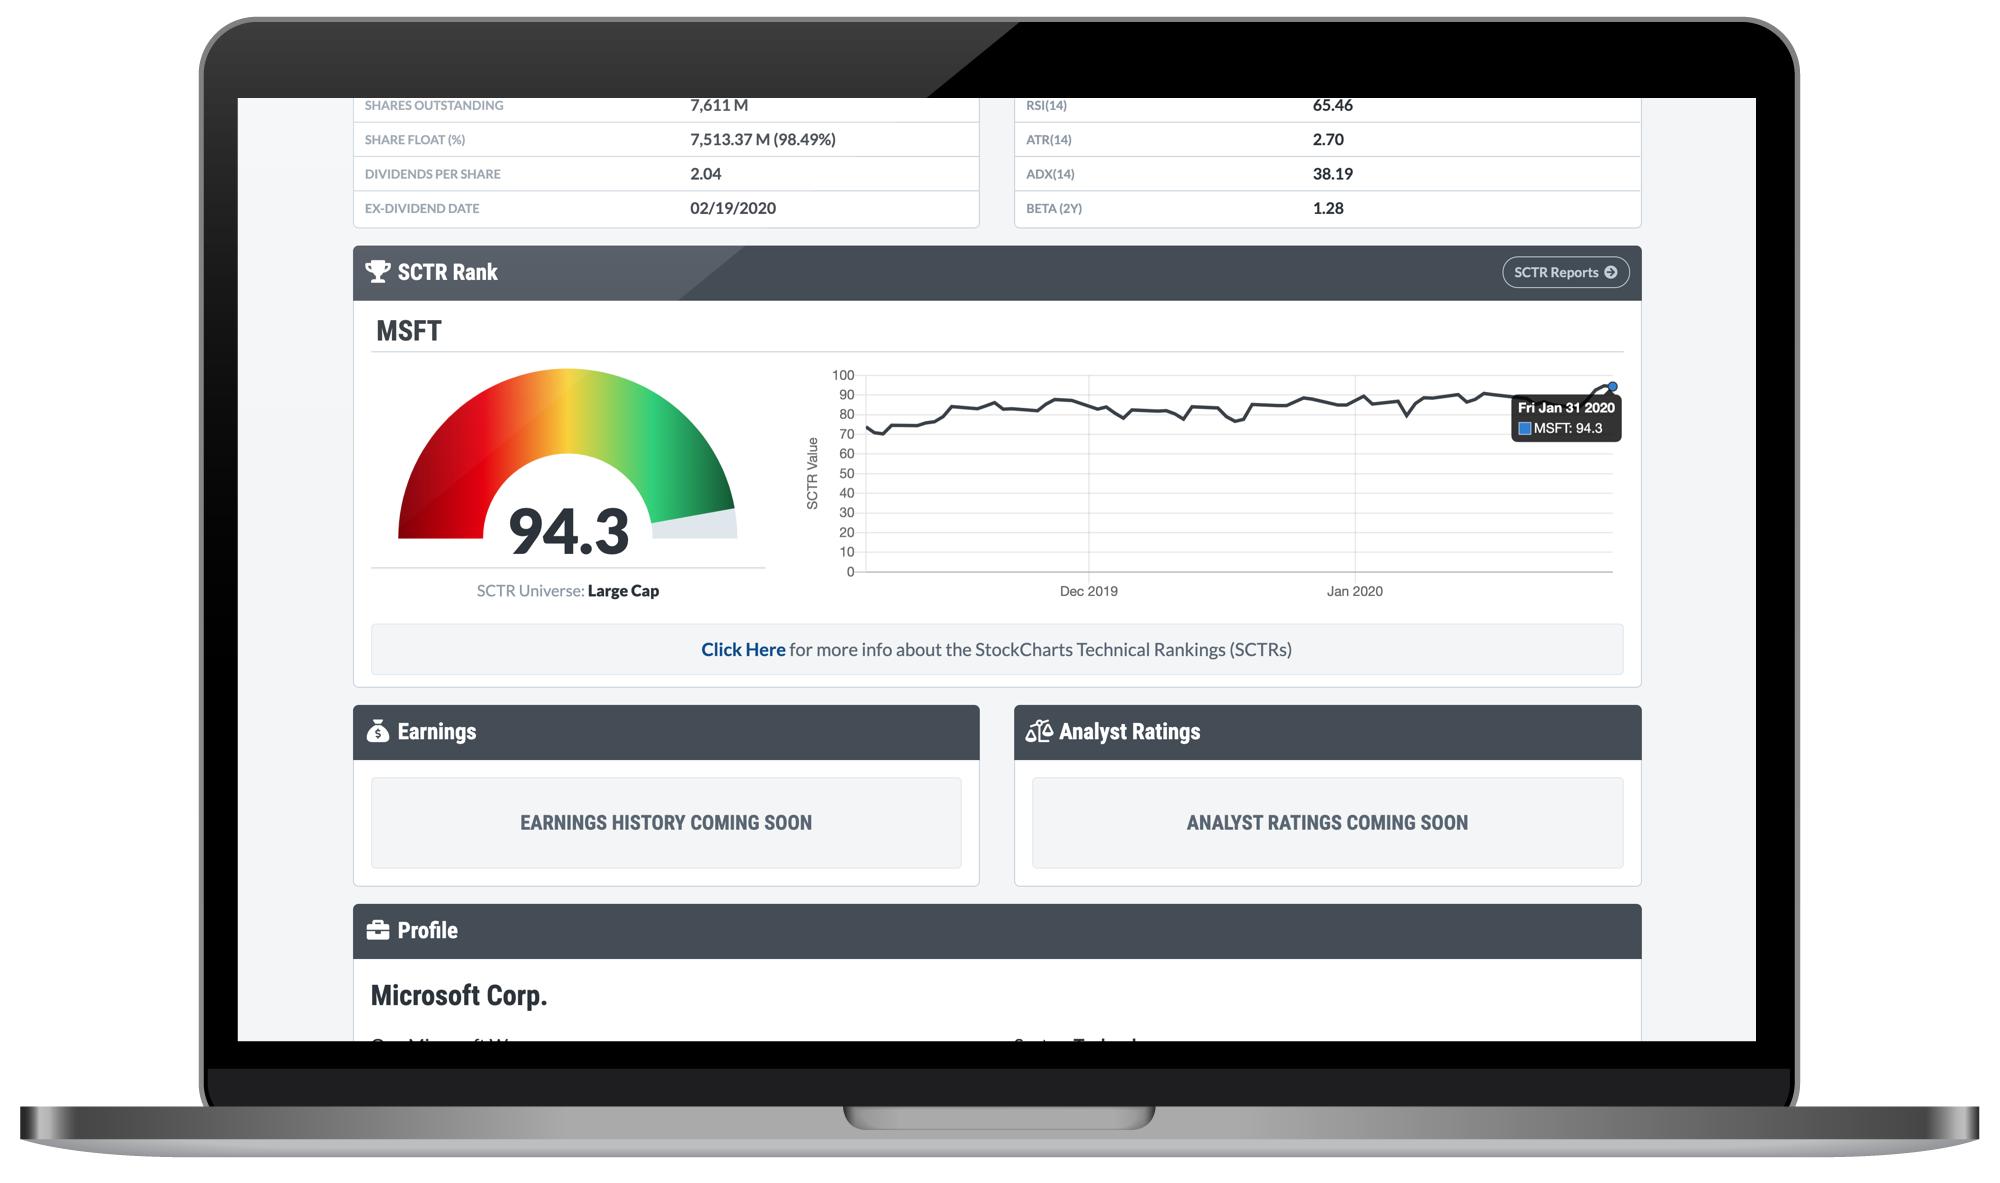
The SCTR rankings have become a beloved indicator on StockCharts, used by many thousands of investors every day. With that in mind, the Symbol Summary page lets you you can now view SCTRs like never before.
Pull up a stock or ETF and you'll see the latest value displayed in a colorful, easy-to-read, meter-like format. This quick speedometer view for the SCTR is then complemented by 3-months of history, charted in the graph on the right. You can hover over each point on the chart to see an exact value pop up in a "tooltip".
We continue to hear from more and more people who are discovering the StockCharts Technical Rankings (SCTRs) and incorporating it into their analysis system, so I'm thrilled to help display this powerful indicator even more prominently with our new Symbol Summary page.
Corporate Info And ETF Descriptions
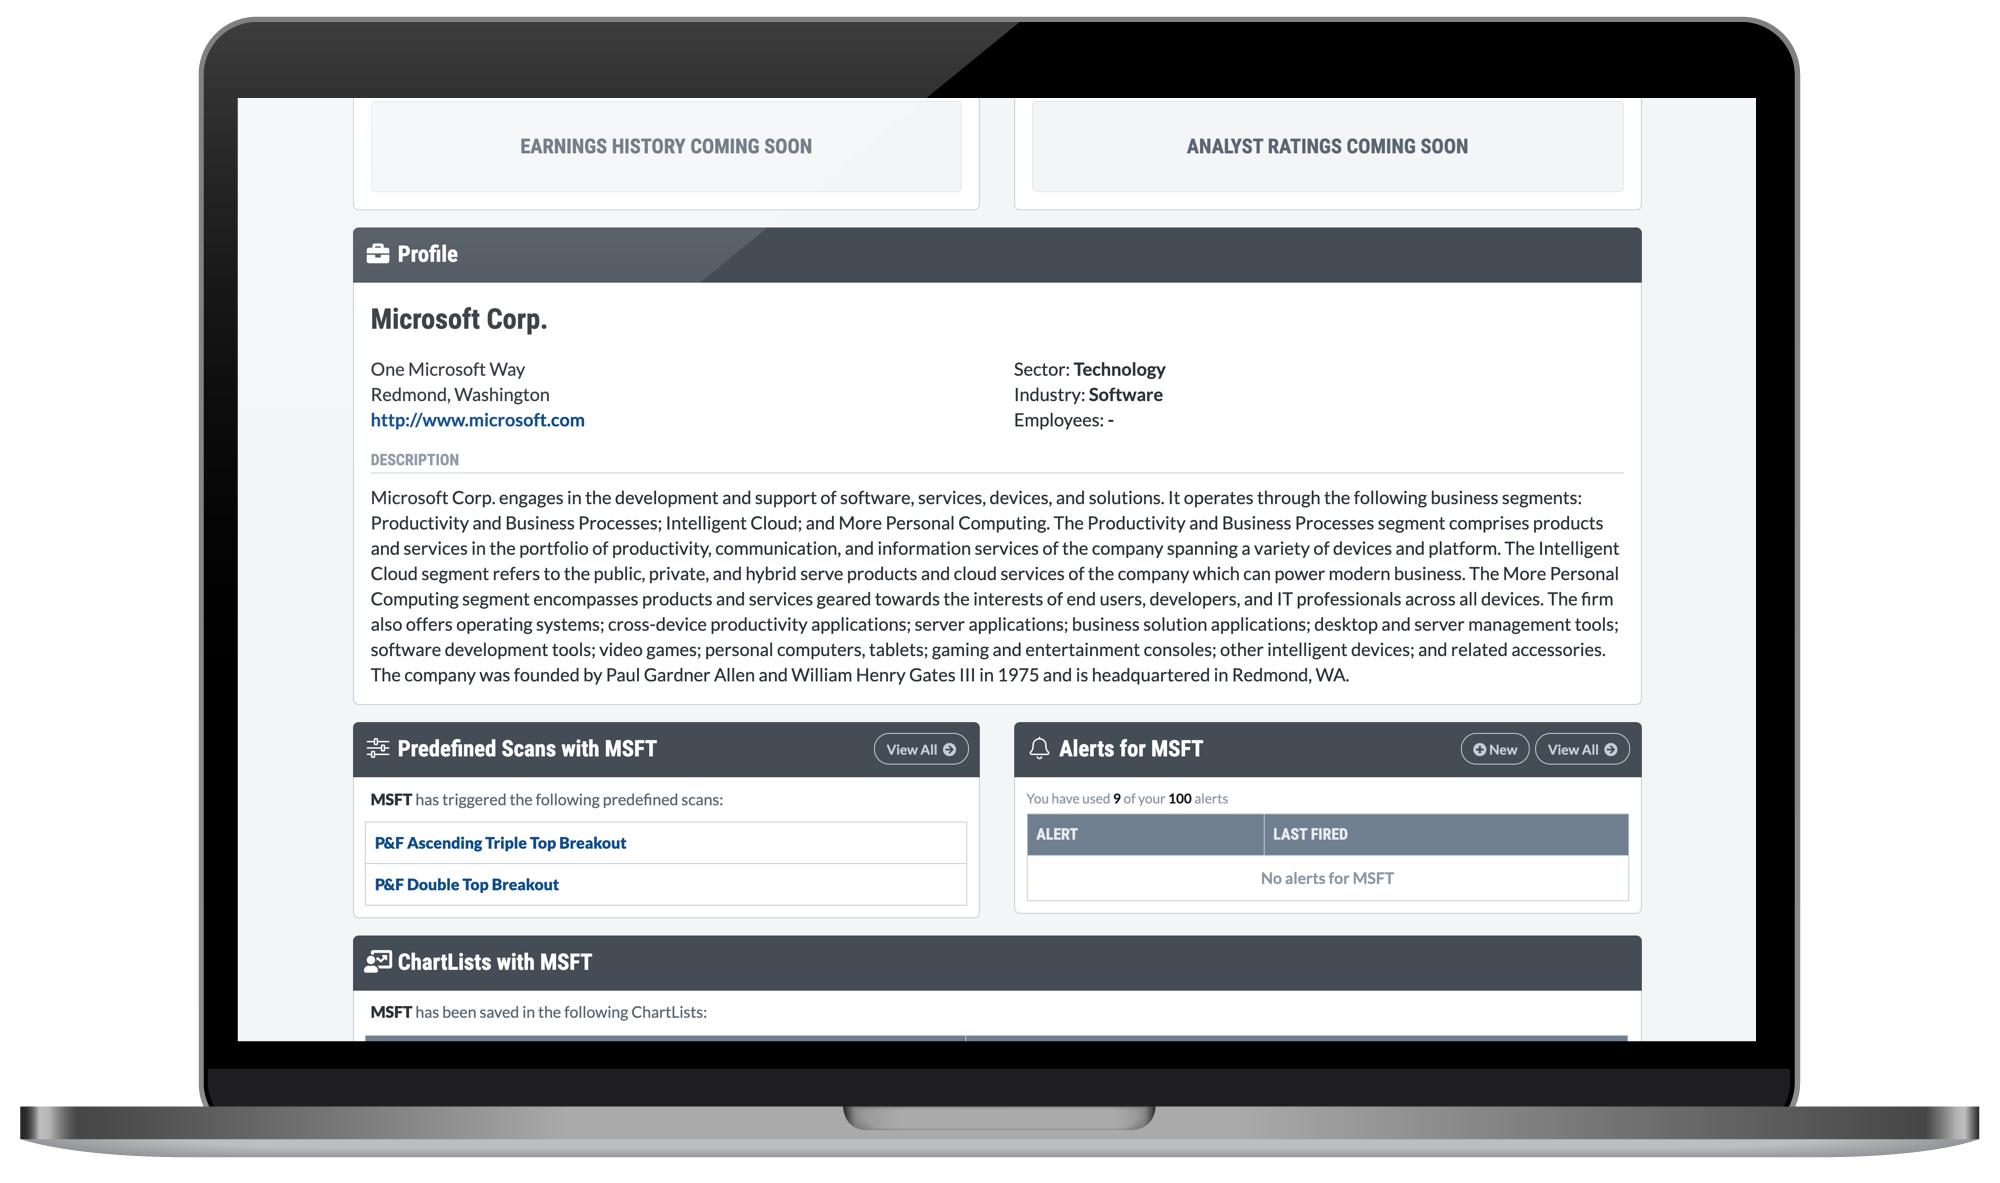
Below the SCTR panel, you'll find a Profile section that includes a variety of corporate info and other descriptive details for many stocks and ETFs. If you're looking at a stock, you can see the company's address and a link to their website, along with sector and industry classifications off to the right. Most importantly, we use this panel to show you a company description that helps provide a general overview of the business, their products or services, their history, etc.
If you're looking at an ETF, this panel won't include an address, but it will still have a link to the external website associated with the fund, plus a description of the ETF's scope, strategy, purpose and more.
The Profile panel provides a great way to learn more about the symbols you're researching, something that goes beyond the charts, technical stats and fundamentals and looks more broadly at what the company is and what they do, or what the fund aims to achieve.
ChartLists, Alerts And Predefined Scans
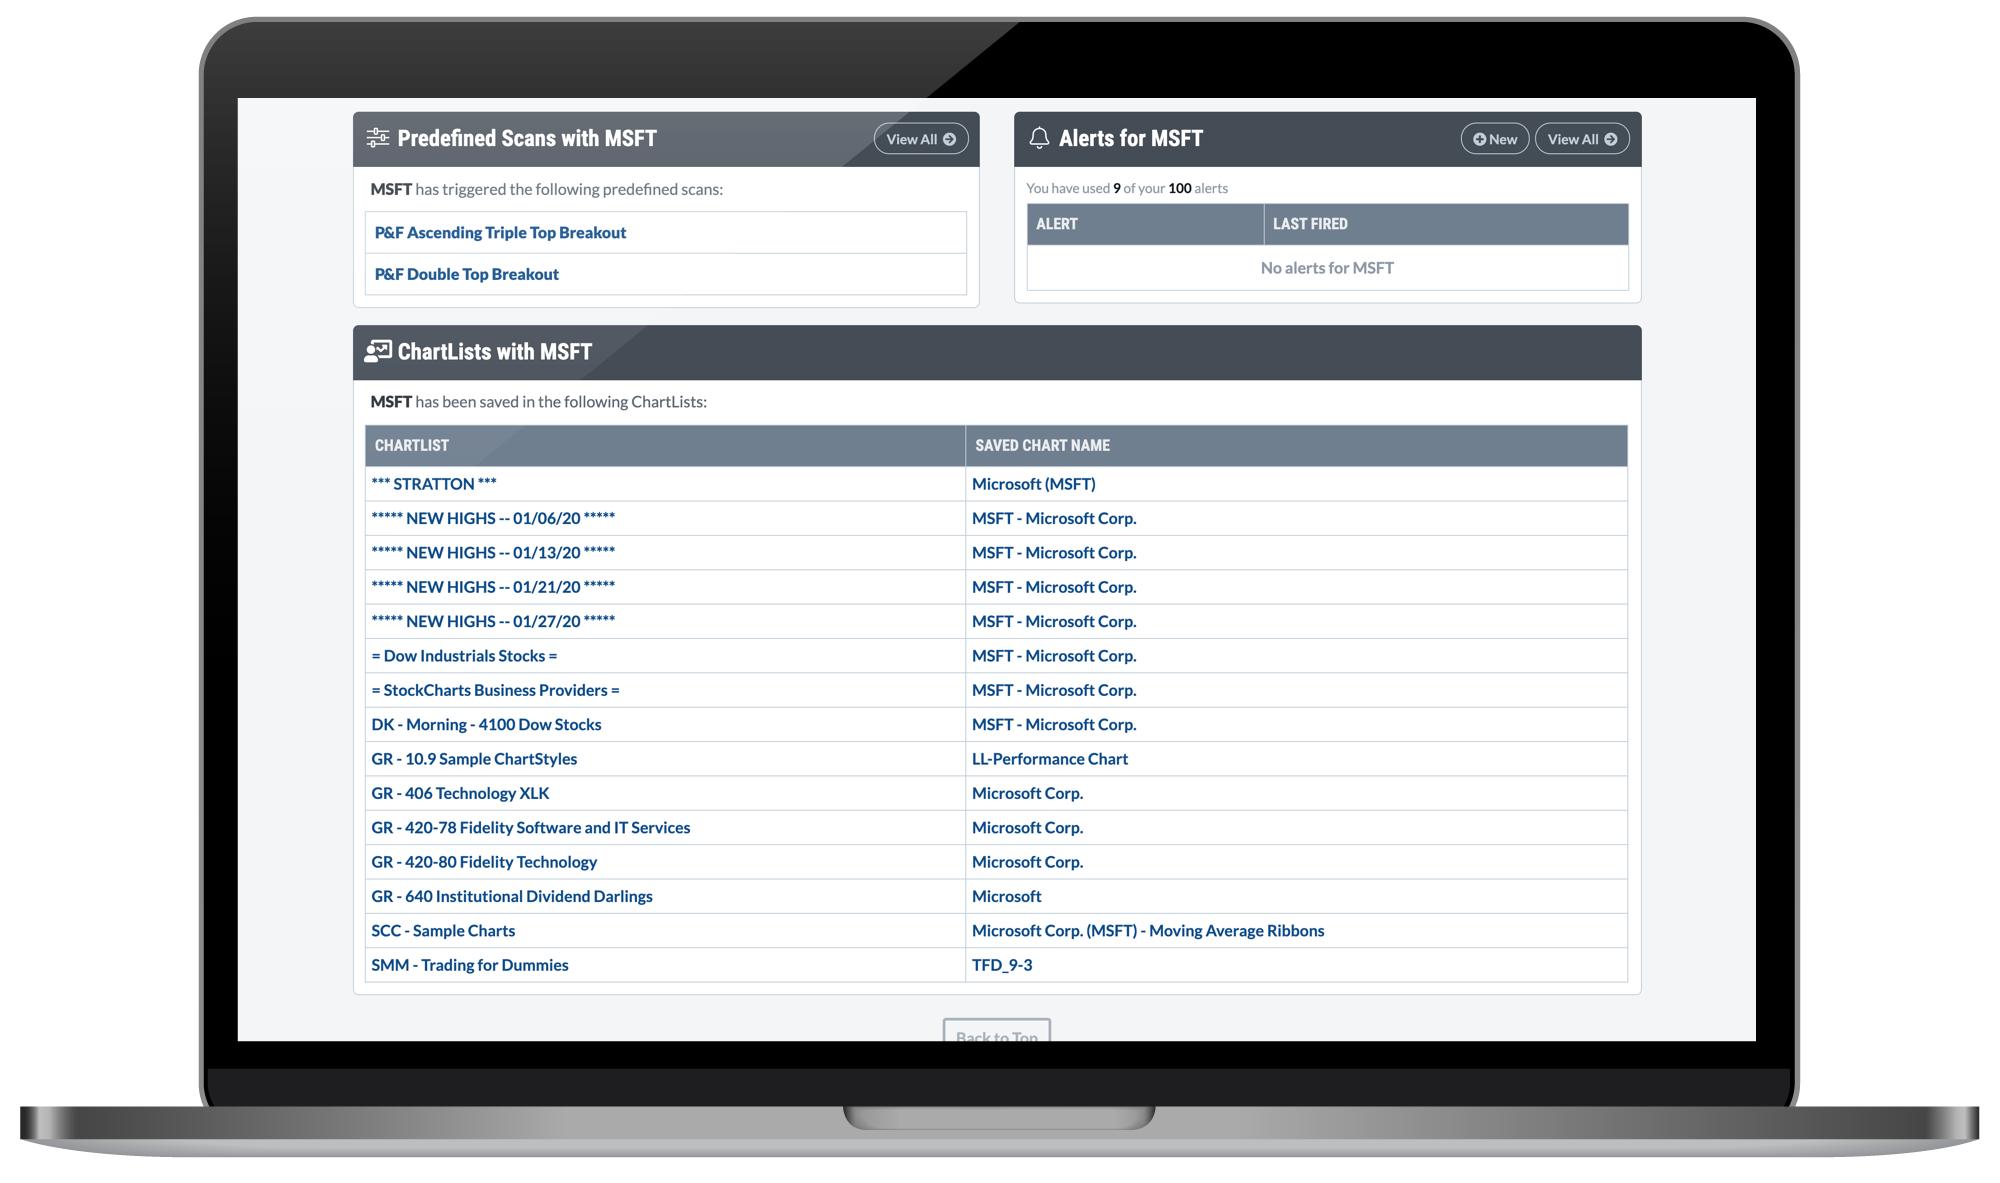
Towards the bottom of the page are three unique features that you'll absolutely love as a StockCharts Member. When you pull up a symbol, we'll automatically show you any of the ChartLists in your account under which you've saved a specific ticker. You can click the name of the ChartList to quickly jump over and see what's there, or click the name of the saved chart to navigate over to that specific SharpChart or P&F chart.
In the Alerts panel, you'll see a list of all custom alerts you've created for that ticker symbol. This a unique way to see – and remember – what you've set up in your account. Links above the table will also allow you to create a new alert or view all of your saved alerts from the "Alert Center".
Finally, in the Predefined Scans panel, we'll display any and all predefined scans that the symbol you're looking at has triggered. For example, if you've got a stock on the Symbol Summary that's making new highs and triggering our "New 52-Week Highs" scan, you'll see that right there in this panel. Click the name of the scan and we'll show you all of the results for it, including other stocks and funds that meet the associated criteria.
Member Actions
Back up at the top of the Symbol Summary page, you'll find some buttons under the "Member Actions" label. Once you've logged in, you'll be able to save any symbol from this page directly into one of your ChartLists. You can select a list, set a name, and choose the ChartStyle you want to use when saving the new symbol. If you're browsing through different tickers and come across something that you want to dive deeper on, this is a great function to keep mind.
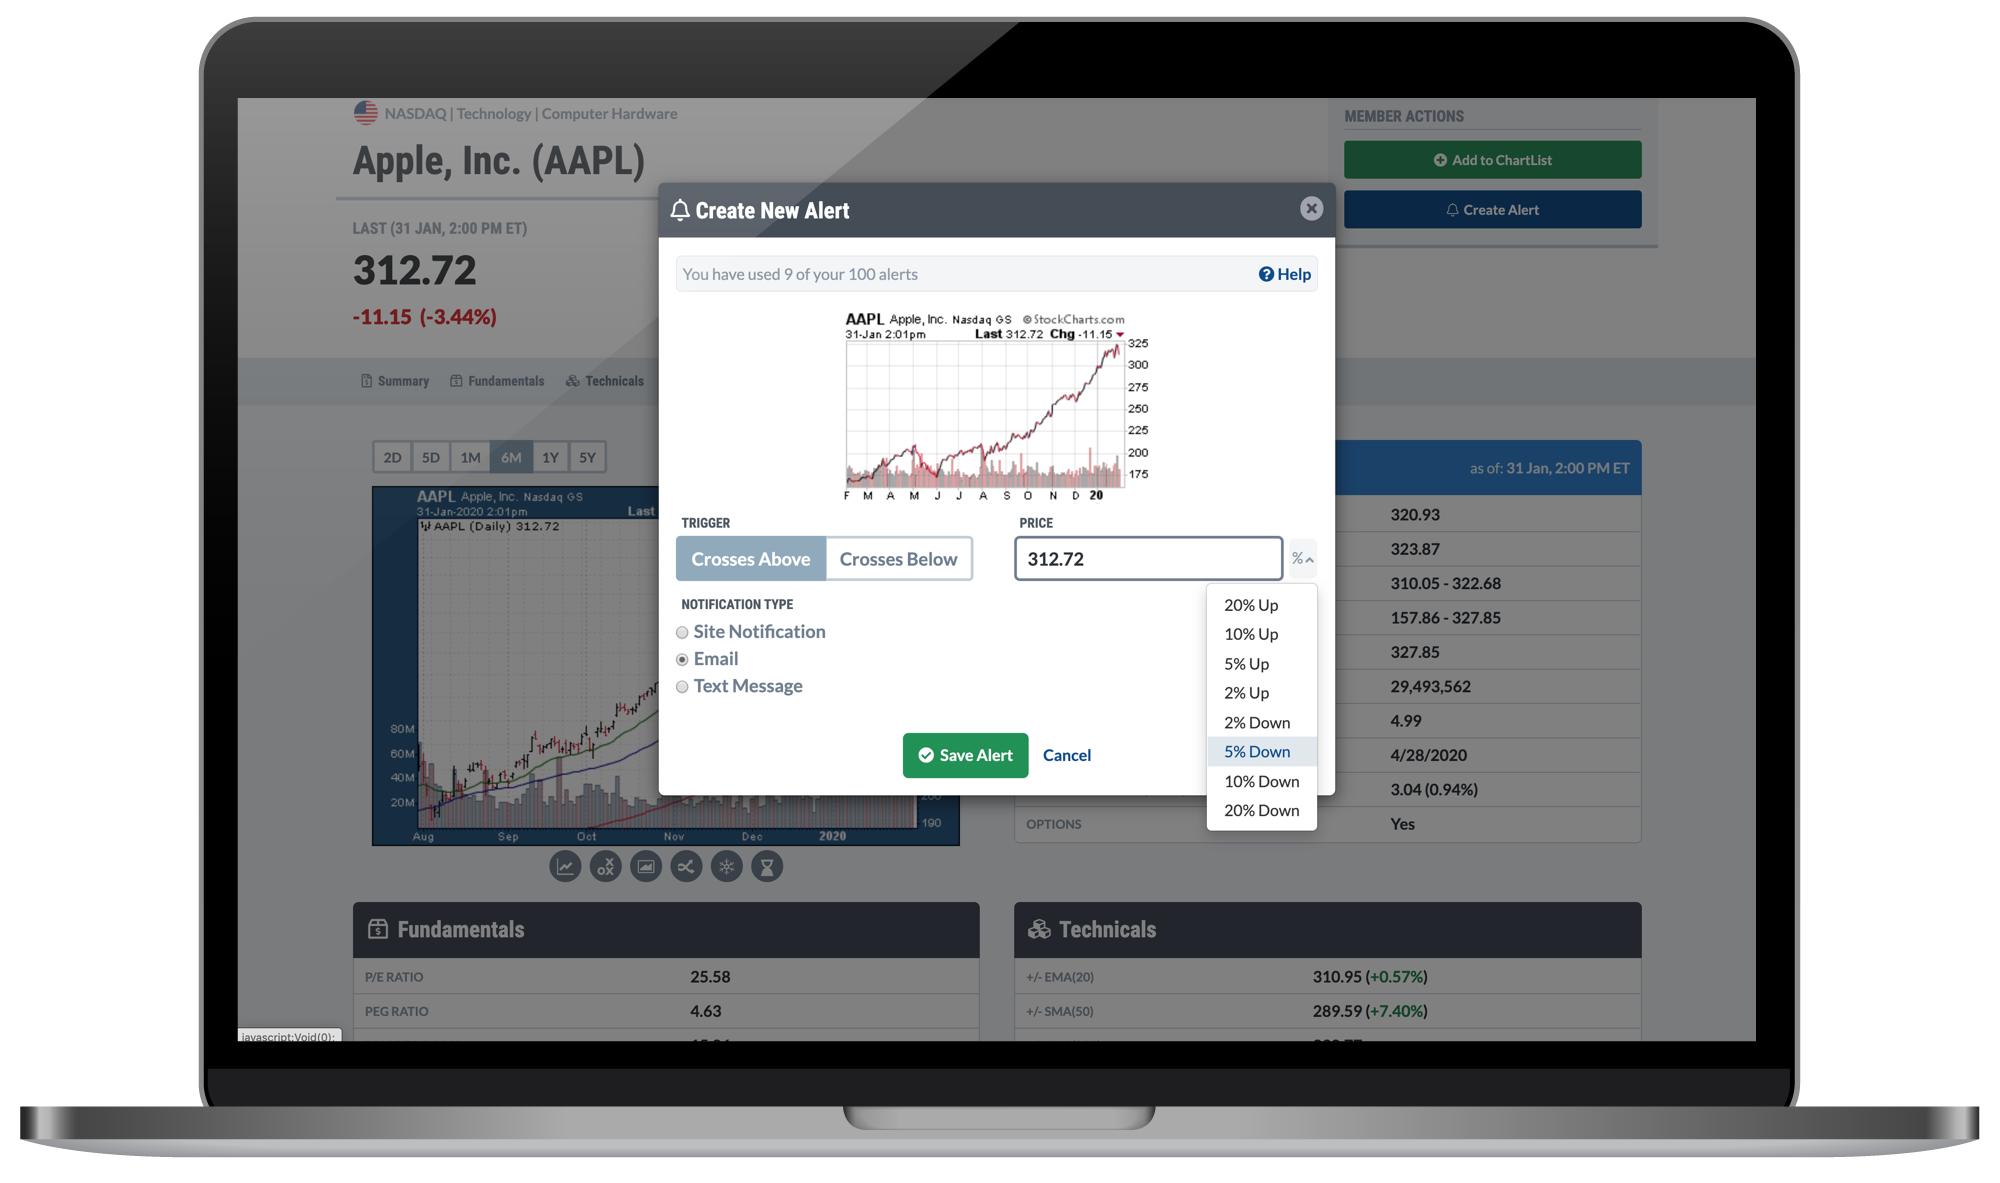
The other button under Member Actions allows you to create a new price alert for any symbol, right from this page. Just like saving to a ChartList, if you find something that you want to keep a closer eye on, the Create Alert function is a powerful feature of the new Symbol Summary. Plus, you'll then be able to see all of your custom alerts for any particular symbol in the Alerts panel further down the page.
Fully Responsive - Optimized For Every Device
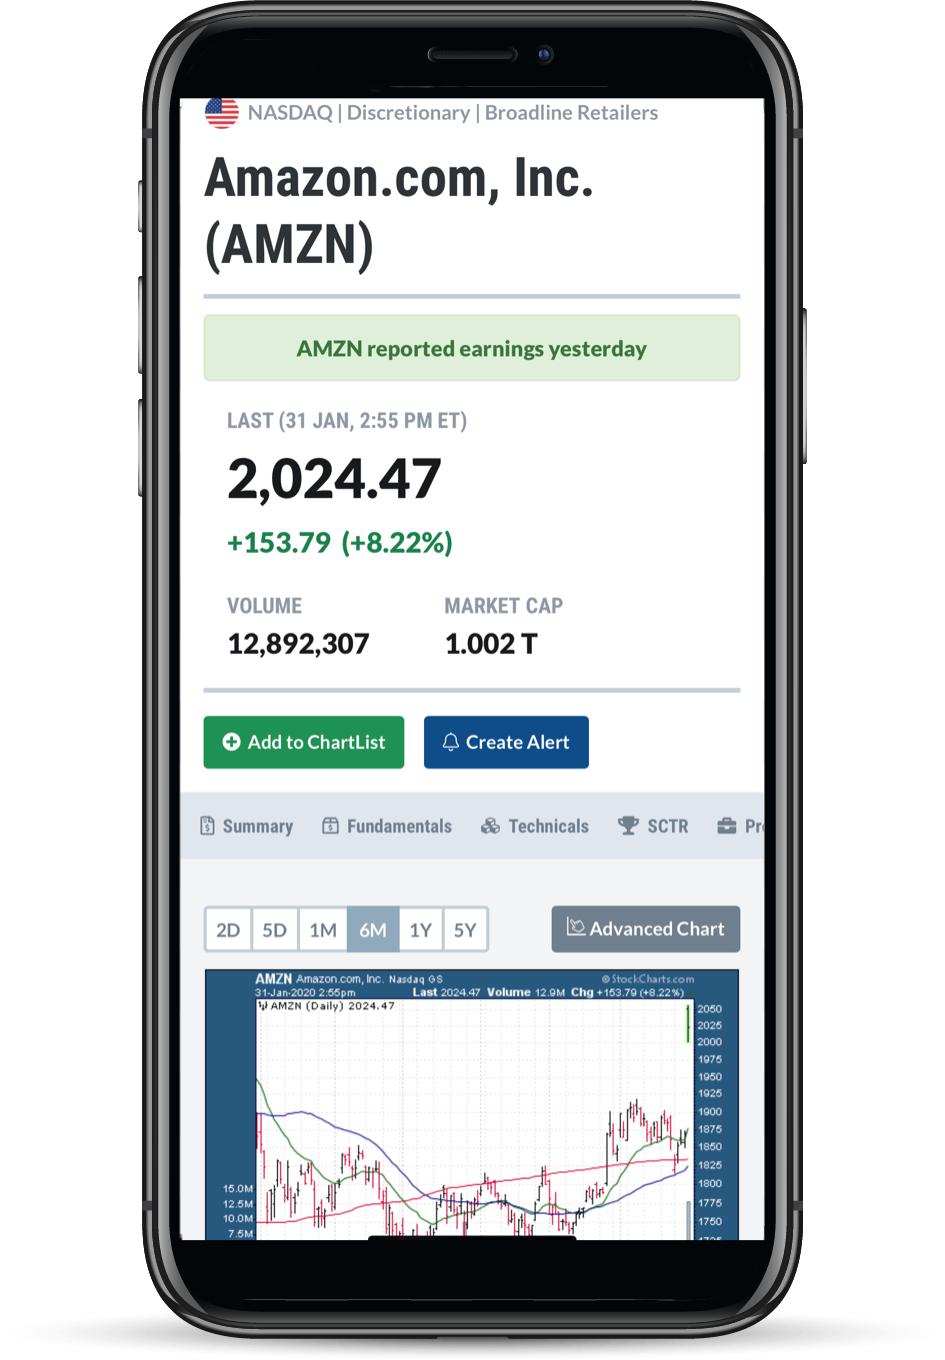
Another great aspect of the Symbol Summary page: it scales to fit any and every screen size, so you can keep the analysis going from anywhere, even while you're out on the go. Whether you're on a desktop, laptop, tablet or smartphone, the Symbol Summary will automatically size to fit your device and give you a great view of the symbol you're interested in.
I've been using this new tool on my phone, for example, while I'm away from the office or even just relaxing on the couch flipping through stocks. It's a wonderful way to take a quick look at any symbol and still get a very complete picture of that stock, fund or index.
So with that, I think it's time for me to let you go explore the new tool for yourself. But as with any new feature, we'd love to hear your thoughts! As you start to play around with all that's there on our new Symbol Summary page and begin to incorporate this into your trading/investing/analysis workflow, drop us a line and let us know what you think. We welcome your thoughts and feedback and are excited to help make this an even more valuable resource for you on StockCharts.
Chart On, My Friends.
Grayson Roze
VP of Operations, StockCharts.com
Author, Trading For Dummies
Chart on, my friends.
Grayson Roze
- Director of Operations, StockCharts.com
- Author, Trading For Dummies (Wiley, 2023)
- Author, Tensile Trading: The 10 Essential Stages of Stock Market Mastery (Wiley, 2016)
- Co-Founder, StockMarketMastery.com
- Twitter: @GraysonRoze