When applying the signals from the 4th Dimension, you will always firstly apply the standard defaults. This is designed to give the simplest and most commonly used variables that it offers. However, it is possible to adjust what you wish to see in a variety of ways, the most important of which are listed below in chronological order.
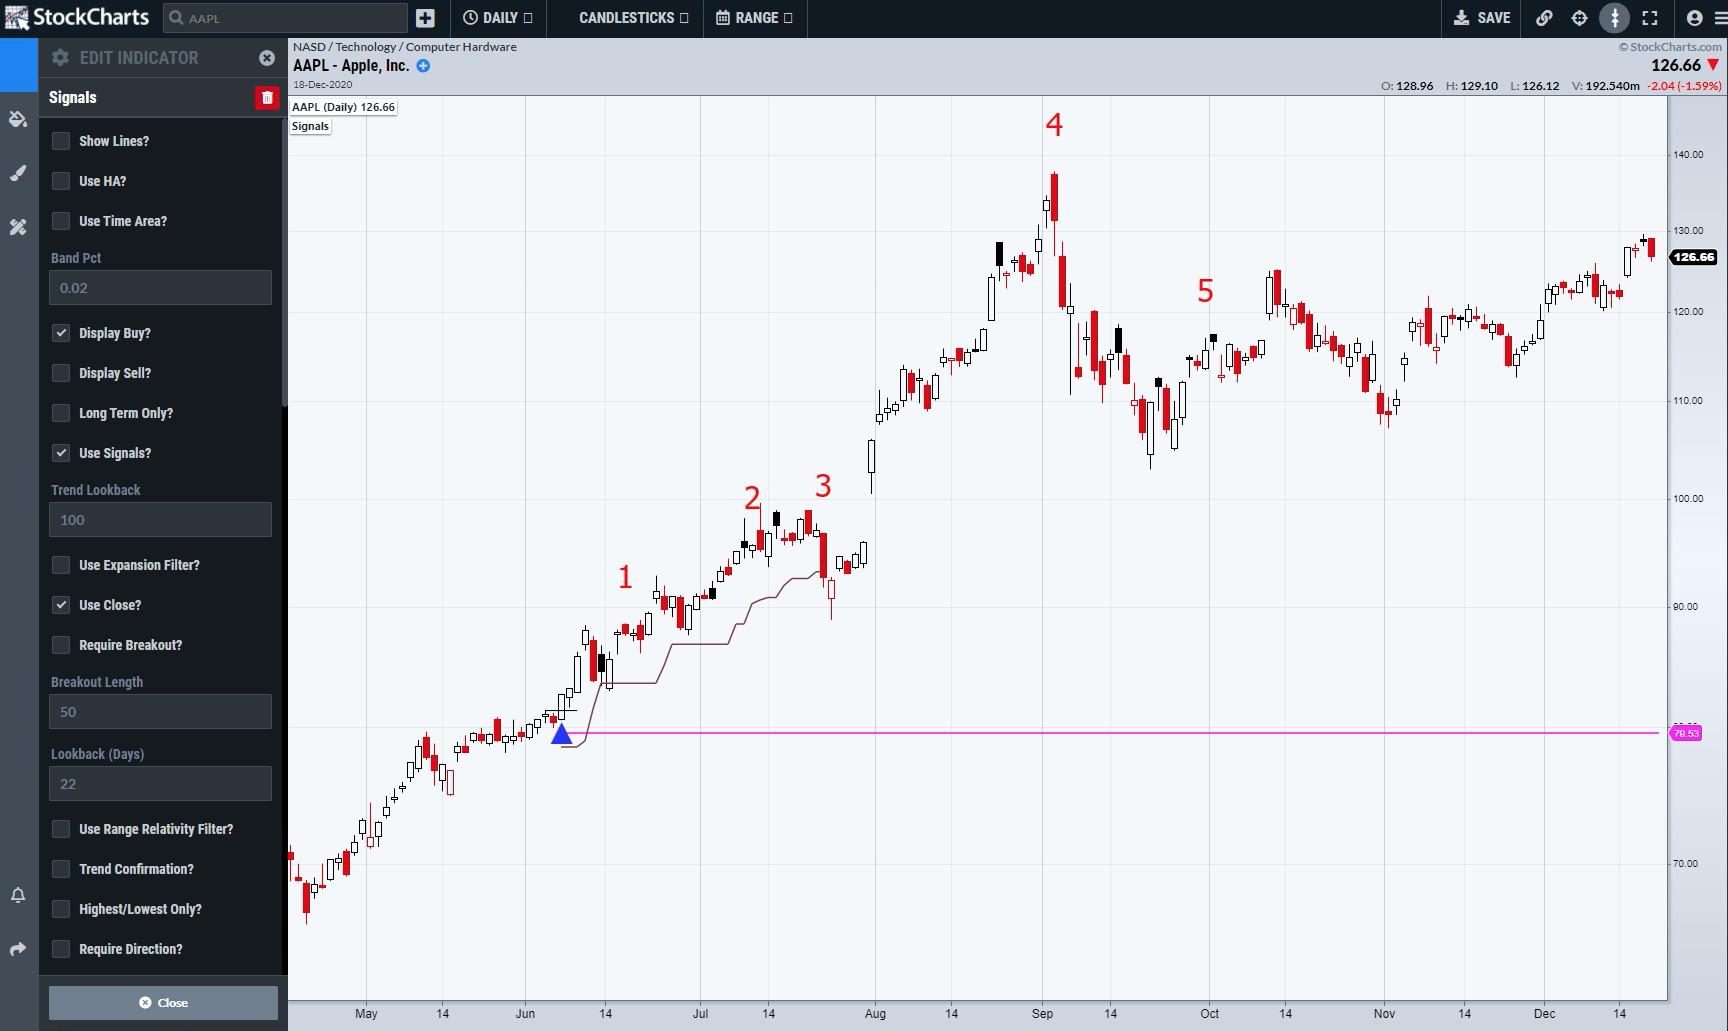
When selecting signals, they will appear as shown below. If no trade is displayed, that means that one has not occurred on the data you are viewing. Signals can only be place on daily data and the defaults and variables are listed on the left-hand side.
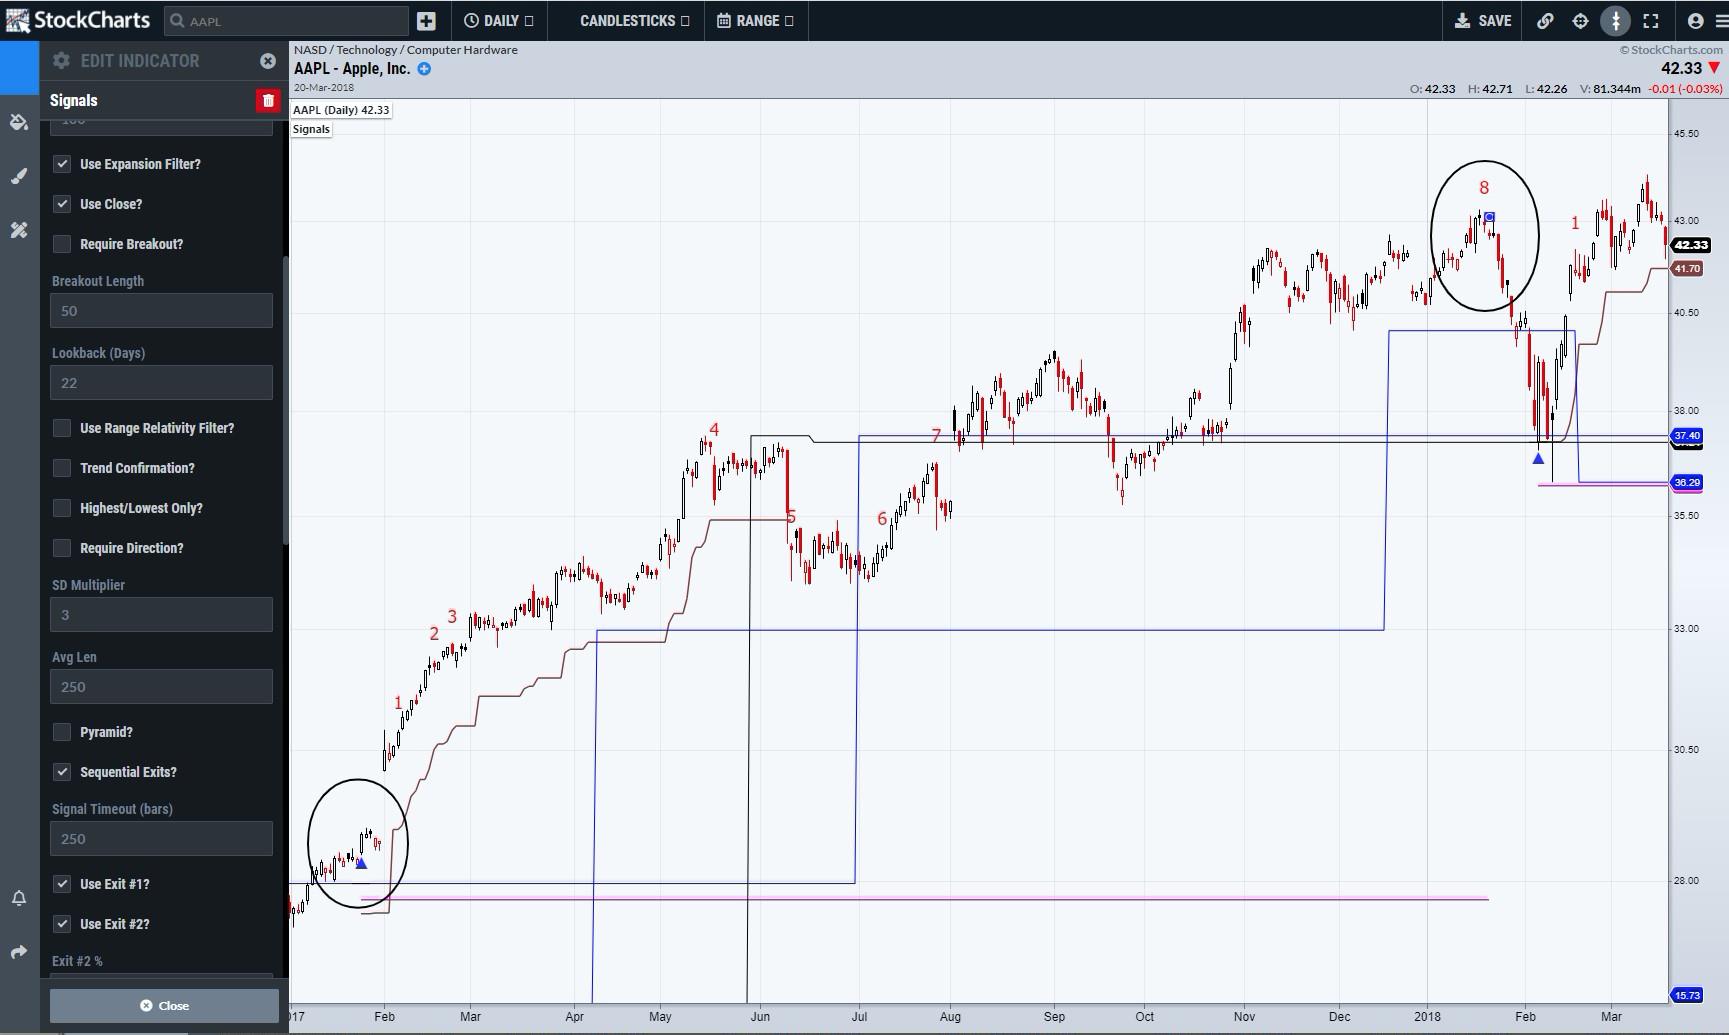
Apple (AAPL) shows the entry and a total of 5 exits. If you see a chronological number missing, it means that there was more than one exit on the same bar.

Activating Show Lines will place the Peak Energy and Expansion Support and Resistance lines for the Weekly and Monthly Timeframes.

Use HA changes what data is being analysed by using Heiken-Ashi charts. By default, they can create different High Lows to a conventional chart and, therefore, show different support and resistance points.

Band Pct is one of the most important variables. Defaulted to 0.02, it means that any entry criteria must occur within 2% of any of the Supports or Resistances. It is possible to force the beginning a new trade if you have entered a market, by raising this number to a higher value.

When selecting Signals, only Buys are displayed. You can Switch Display Sells on to create new Short positions and terminate any previous long position.

Long Term only is connected with Exits. If selected, it will remove the Peak Exit. Apple shows it firstly, with Peak being the first exit and then disappearing when Long Term is selected.


Use Expansion Filter will decrease the number of entry signals that will be generated. This is done by applying a greater range at the entry point.

Require Breakout is designed so that Entry Points can only be true if a stock is making new highs. The Breakout Length defaults at 50 bars, and the Signal on Apple was a breakout signal, as price broke above the final monthly resistance (blue line).


Use Range Relativity Filter stipulates that an entry point can only generated if a Range Relativity Aggressive pattern appears within the desired percentage of a Support or Resistance Line. This means that trades are reduced significantly. The Adobe (ADBE) chart shows such a trade back in 2019, as circled at Monthly Support. It is also important to Remember that Range Relativity Aggressive and Passive are NOT part of the Automatic Exit criteria within the Signals system. Therefore, they should be placed on your charts as a default if wishing to see when the pattern is true.

Require Direction will disable Breakout trades, so trades can only appear as buys when the Trend is down. It analyses this criterion over the previous 22 days. Apple shows a signal at major support, and the breakout signal of 2020 would no longer appear.

SD Multiplier manipulates how far anyway the Pink Line (Stop Loss point) is away from your entry level. This is calculated dynamically with the Range Deviation Pivot study so that stops are connected to the recent price action. The Stop Loss point is activated when price CLOSES below the Pink Line, meaning the Signal has finished.

Pyramid means that, if selected, when a new entry point criteria is met and a previous signal is still active, then a new trade will be activated. This also means that any of the exits can be true, even if they have been true in the previous trade as well. With Pyramid not selected, each exit can only be true once, meaning that if you wanted multiple UFO exits, for example, you would place the Ufo study on the chart. When a pyramid appears a fresh pink line, a stop loss point is created. The chart shows Apple with a recent pyramid trade.

Sequential Exits by default are switched off, which means that exits are flagged by numbers. Turning it on means that the name of the exit will be displayed instead.

Signal Timeout dictates how long a trade can last. Defaulted at 250 bars, a Blue circle will appear above the Day and the trade sequence ended.

The final part lists all the exits. By default, they are all switched on, apart from Exit 3. This is a break-even stop. You set what percentage the trade must be winning by and, if that occurs, an exit will appear if price returns to your entry point. This will end the trade in a similar fashion to the Stop Loss Exit. The brown line on a chart is a Trailing Percentage stop. The last exit is Stochastic Steps-based. You can adjust what timeframe you wish for the Steps to be calculated on and the threshold for what constitutes the Threshold that must be reached before the Steps reset to zero.

In order to provide dynamic help during the 1-month free trial I am offering in the New Year, I will be providing additional access to my 4th Dimension channel. Within this will be a daily update on all the signals that have appeared on the previous day, which is covering 5000 stocks and 200 ETFs. You will also get access to my commentaries on the Dow Jones, Nasdaq, S&P 500 and Russell Futures. Every Saturday, I produce weekly update videos on those markets, plus Oil, Gold and Silver and the Dollar. This is where you can also communicate directly with me with any questions or comments you may have.

I can be contacted at shaun.downey@aol.com to answer any questions.
Shaun Downey
