Finding Value in an expensive market is problematic unless there is a method for identifying areas of the market that are being neglected. If you're running a Fund, there is the additional problem of what Sectors or Stocks to be short in order to have some sort of balanced portfolio. Many years ago, when running an American Equity Fund, one of my other tasks was to find a either a Fundamental-based system or Technical one to identify what Sectors were just about to take off and become the leaders of the market, in what is an endless process of rotation.
A thankless task, especially on a Fundamental basis, and one that I doubted I could solve. Technical was easier, but usually involved Breakouts, which often increased risk. It is also extremely time-consuming, as even a Technical System needs to be cross-referenced against news events and company Results. Eighteen months down the road on a fundamental basis, there were more questions than answers as to what made a stock or sector become fashionable and lead the market. It appeared to be completely random, even within the same sector.
However, the relentless process of connecting Fundamentals to Technicals and Sector Rotation, looking at thousands of charts, eventually led to my Eureka moment. I had been attacking the problem the wrong way around. Instead of trying to predict, why don't I just let the market tell me?
Think of it as fashion. Things come into fashion and go out of fashion, and it is no different with stocks and sectors. Amongst the best-performing and highest-ranked sectors this year are Media/TV/Radio, Retail Wholesale Jewelry and Department Stores. The last two in particular seem nonsensical. Six months ago, those 3 sectors were languishing in the Bottom 5% of the market.
In contrast, Energy/Solar was the darling of the market in the last quarter of 2020, sitting proudly at the top of the tree. In this quarter, it is the third-worst performing sector. Therefore, when looking for value, I concentrate my efforts in the stocks in the bottom 5% of Sectors and, if they reach the top 5%, I am looking to withdraw from that market if positioned or look for signals to get short.
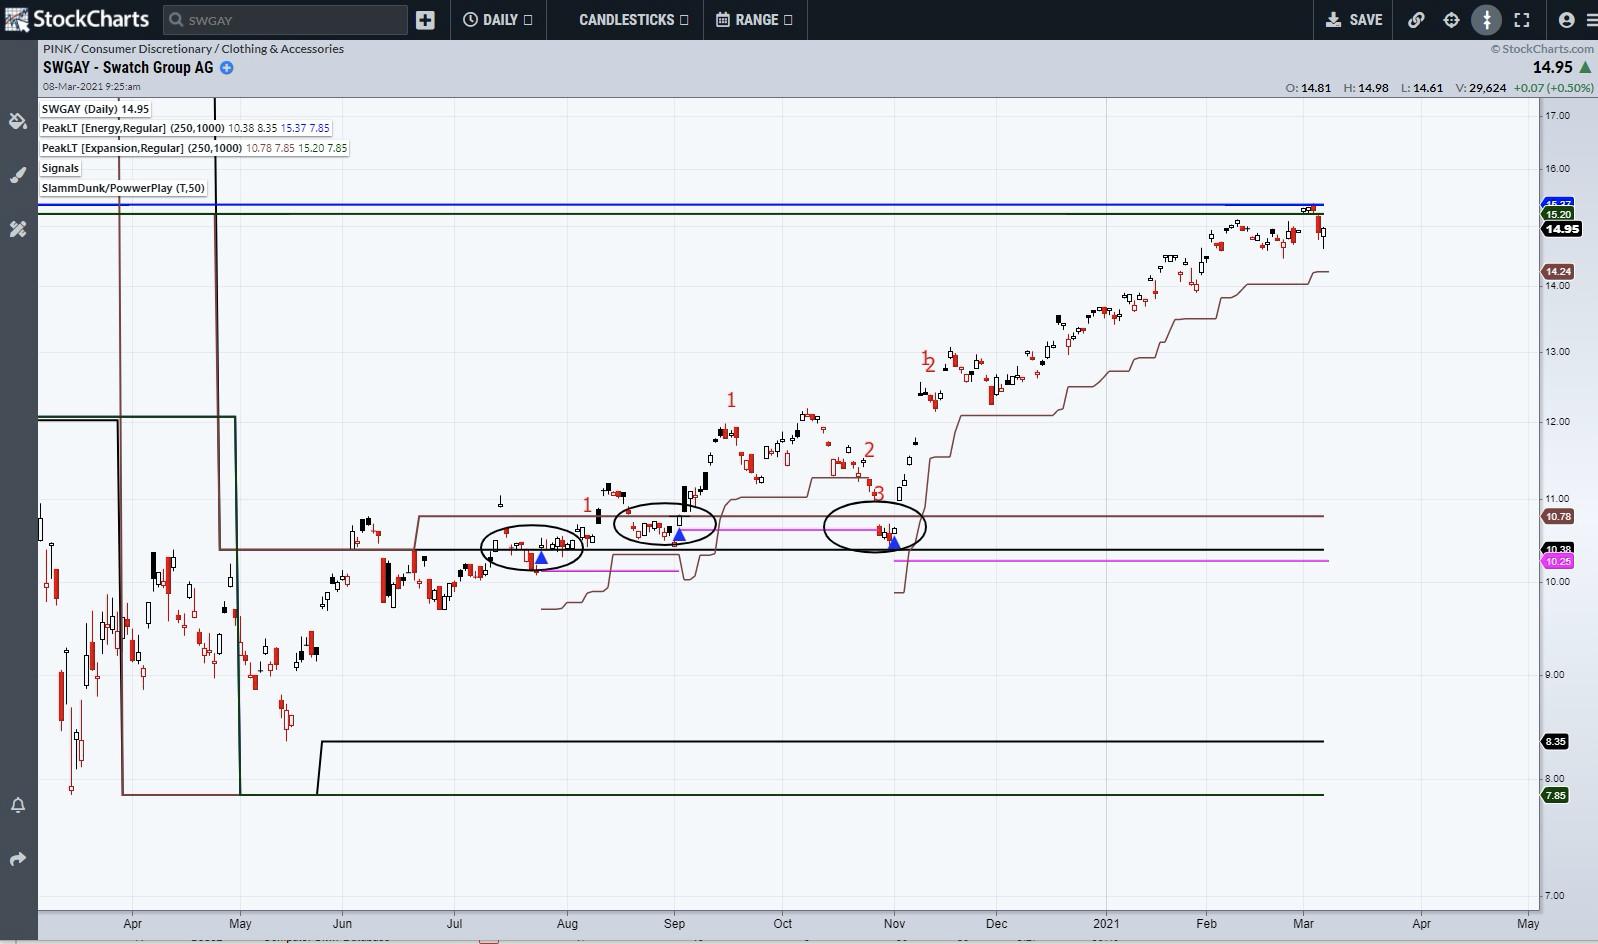
Swatch (SWGAY) is now in the Number 1 Sector, having been in the bottom 5% six months ago. Its P/E is a whopping 748 against a range of 9 to 770. The stock has risen 50% since November which begs a simple question: Are they selling 50% more watches?
The chart shows that, whilst it was unloved, there were 3 separate 4th Dimension signals (blue triangles). All three were in the band of weekly and monthly support. Looking at where we are now, the stock has reached a major upside target in that tight zone of resistance that has stopped the rally. The trailing stop is in place (brown line) and it will take a breakout above that resistance to restart the trend.
When looking at unloved sectors and picks within them, there are a couple of quick basic fundamental checks I make. Beyond the obvious, like what do they do, I am interested in its current P/E in relationship to its range of the last 5 years. This gives me an instant, if crude, recognition of where it is now in relationship to itself. Ideally, I want it to have a positive EPS Growth Rate and, as a bonus, a Yield. Additionally, in the current environment, a Large Short interest is also a positive.
Sand Inc. (SND) is a recent classic example. Involved in Fracking (could it be any worse), its P/E languished at 3 with a 5-year range of 2 to 65. 10% of the Float was Short and, more importantly to me, based on the average daily volume, it would take 8 trading days to flush out all those shorts.
The chart shows two 4th Dimension signals within the sideways pattern that were above key weekly support. The Pink Line is the automatically-generated stop out and was therefore low risk. One resistance lay above, which was broken with a Powwerplay Buy Signal (green square). Two exits have been generated since the entry, but there has been no news at all that would justify the 100% jump.

Utilities are particularly boring at present, with most sectors sitting in the bottom 5% where they have been for some time. However, in an expensive market, it makes sense to monitor these sectors and watch for signals or sudden movement. It is desirable to have some defensive stocks in a portfolio as well. In the Electricity space, there are two Brazilian companies. EBR has a P/E of 3 against a range of 1 to 9 and EPL lies at 5 against a range of 4 to 37. Both have a healthy yield.
A look at the charts shows that EBR is trapped in a large sideways pattern, which is typical of unloved stocks and sectors. There have been two 4th Dimension triggers in the past 6 months, the first one failing and topping out at the final resistance in December. ELP had a Signal in January that was at a poor location as the stock was near the top of its sideways pattern and resistance was adjacent. Last week saw a fresh signal at the bottom of the range and in close proximity to a zone of support. The reality is that both stocks are currently doing little as the gentle ebb and flow and downward drift this year is largely a product of the Dollar Real exchange rate. Both companies announce results later this week and are on my radar to see if they can generate any independent movement.


I can be contacted at shaun.downey@aol.com to answer any questions.
Shaun Downey