
Selling pressure was extremely broad in Friday with all sectors declining and more than ninety percent of stocks in the S&P 500, S&P MidCap 400 and S&P SmallCap 600 declining. While this kind of broad selling pressure creates a short-term oversold condition, it also reflects a change in market dynamics and points to a corrective period ahead.
A 90% down day occurs when 90% of all stocks in a particular index decline. Chartists can measure this indicator using the Advance-Decline Percent indicators at StockCharts. A reading below -80% means more than 90% of stocks in the index declined on the day. Here is an example calculation for the S&P 500 on Friday:
- S&P 500 Advancing Stocks: +30 (+6%)
- S&P 500 Declining Stocks: -470 (-94%)
- S&P 500 Net Advances: -440 (-88%)
Thus, we have S&P 500 AD Percent ($SPXADP) at -88%, S&P MidCap 400 AD Percent ($MIDADP) at -89% and S&P SmallCap 600 AD Percent ($SMLADP) at -87%. The decline affected large-caps, mid-caps and small-caps in pretty much equal measure.
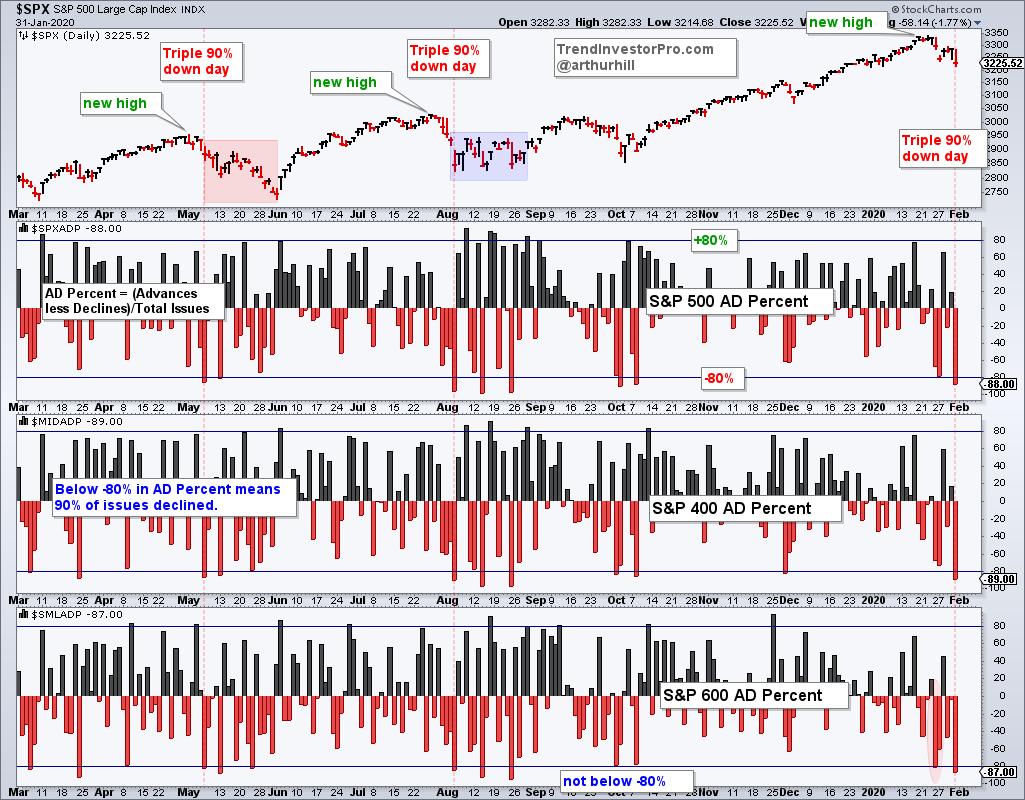
The S&P 500 hit a new high less than two weeks ago and a decline of this magnitude throws a wrench in the bullish flywheel. As the chart above shows, the S&P 500 corrected after the triple 90% down day in early May (red shading) and traded sideways for three weeks after the triple 90% down day in early August (blue shading). Furthermore, a triple 90% down day occurred on 2-February-2018 and marked the start of a 13 week consolidation.
These bearish breadth indications are not long-term problems and not enough to fully derail the bull market. Nevertheless, past performance suggest that we have at least three weeks of instability ahead.
TrendInvestorPro.com uses these breadth indicators as part of a systematic approach to broad market timing. The Index Breadth Model uses nine indicators across three broad indexes, while the Sector Breadth Model uses 33 indicators across 11 sectors. Subscribe today for immediate access to the weekly ETF report, ETF ranking tables, market timing models, ETF ChartBook, weekend video and more.
Click here to take your analysis to the next level
-----------------------------
Choose a Strategy, Develop a Plan and Follow a Process
Arthur Hill, CMT
Chief Technical Strategist, TrendInvestorPro.com
Author, Define the Trend and Trade the Trend
Want to stay up to date with Arthur's latest market insights?
– Follow @ArthurHill on Twitter
