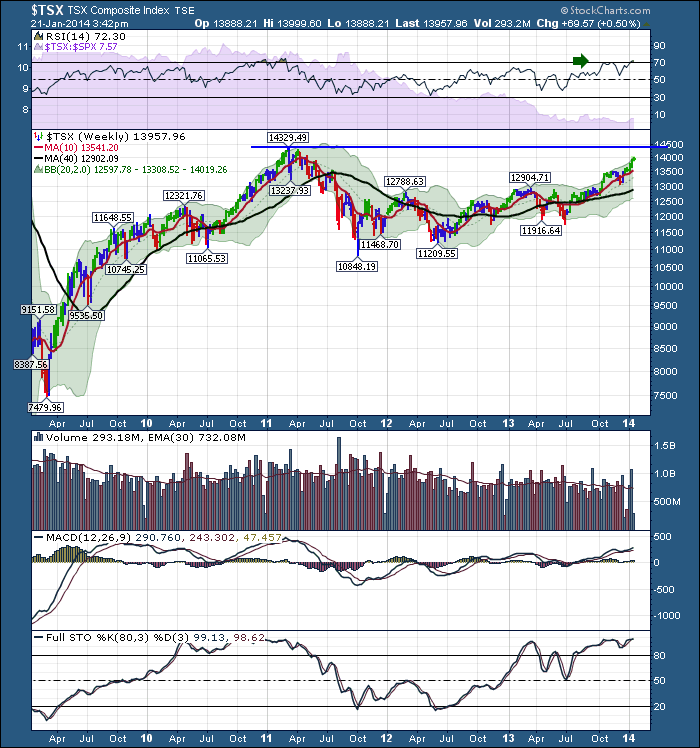
Well, it has been 3 years since the $TSX sat above the 14000 level. After Monday's 101 push, the $TSX was a basketball hoop from 14000. Well, this morning we shot up to 13999.60 and dipped back down.
Here is the long term view.
Most Canadian investors will find the recent rise has made it easier to make some money. The old axiom of a rising tide lifts all boats seems valid here. The portfolio managers preaching dividends forever may finally get to tune their eyes to a wider stock program than the TSX dividends listing.
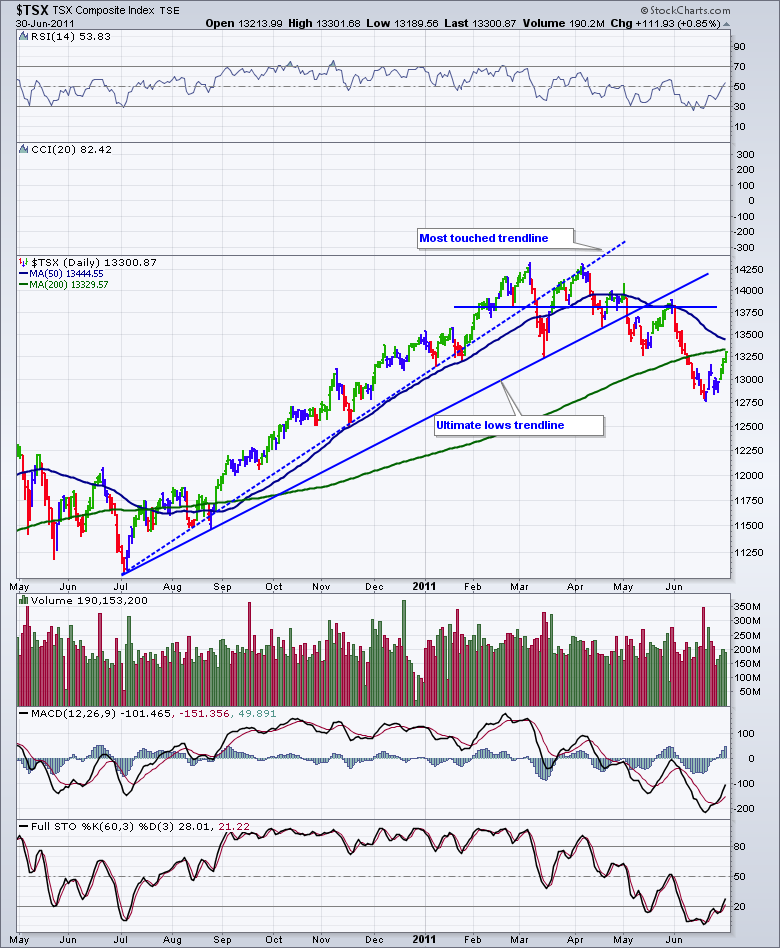
Let's look back to 2010 and check out the rally into the 2011 highs. The 2010 rally was good for 3000 points. We made that high in March 2011 so roughly 9 months from the July low. It was a 30% rise off the low. Notice how prudent the 2 major trendlines would have been.
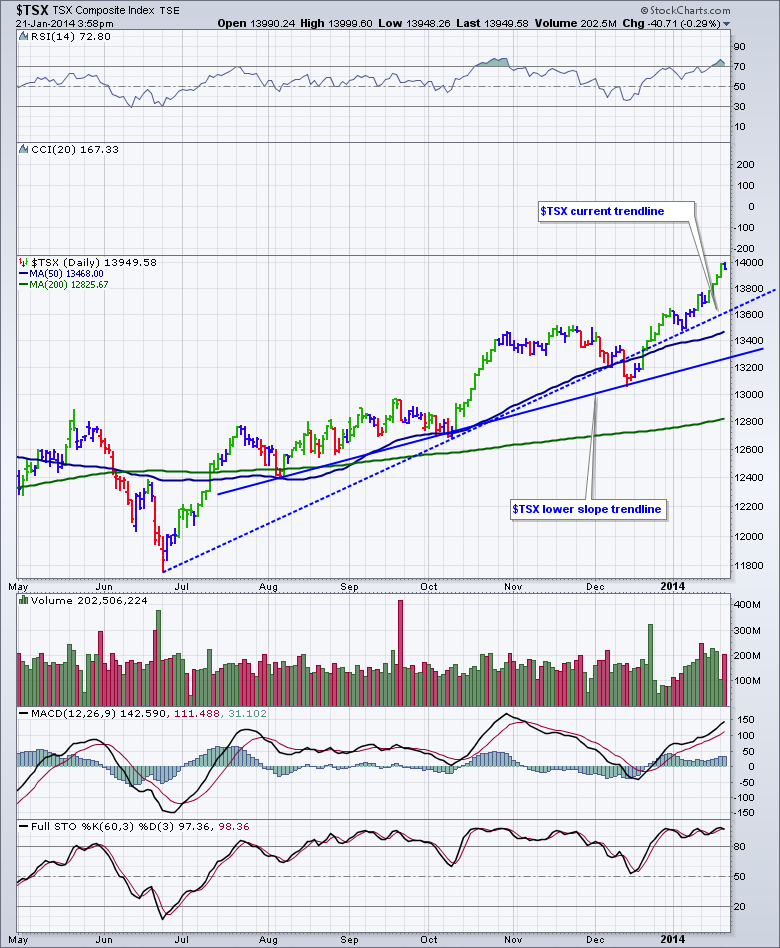
Let's fastforward to today. We started our rally at 11760 on the lows of June 24th. To get to the former resistance level (12900) from the lows was just under a 10% gain.Now a push to 14112 would be a 20% gain. Magically, a gain of 30% off the June 2013 lows would take us to 15288. Our former market top was 15154. Only a 134 point difference. So as we approach the springtime, perhaps the $TSX can make a push up to the 2008 highs. Obviously the first step would be the 2011 highs. On the close of today, the intraday high stayed at 13999.60.
So this is currently a healthy up trend. Should the market weaken here we would expect a test of the 50 DMA and then another test of the previous highs. You can see after the October earnings season, the $TSX went sideways for 5 weeks and then made a gentle pullback. It is interesting that the $SPX has gone sideways for 5 weeks and is now trying to make new highs. We still have GOOG, TWTR, FB and AAPL to report (USA) which should all have strong earnings.
We are in the heart of earnings season. Should be lots of pressure both ways this week.
Good trading,
Greg Schnell, CMT


