There has been a huge volume of news out of the mainstream retailers the last two weeks. It seemed like all of them found their way onto the news channels. It prompted me to dive in and review the sector. I included two from the apparel retailers and the rest are the major ones from the broadline retailers industry group. While the two major apparel retailers are included, they were also two of the strongest stocks in the review. Let's dive in and work through them one at a time.
Dillards (DDS) and Nordstrom (JWN) are in the Apparel Retailers and have been doing extremely well. First off is Dillards.
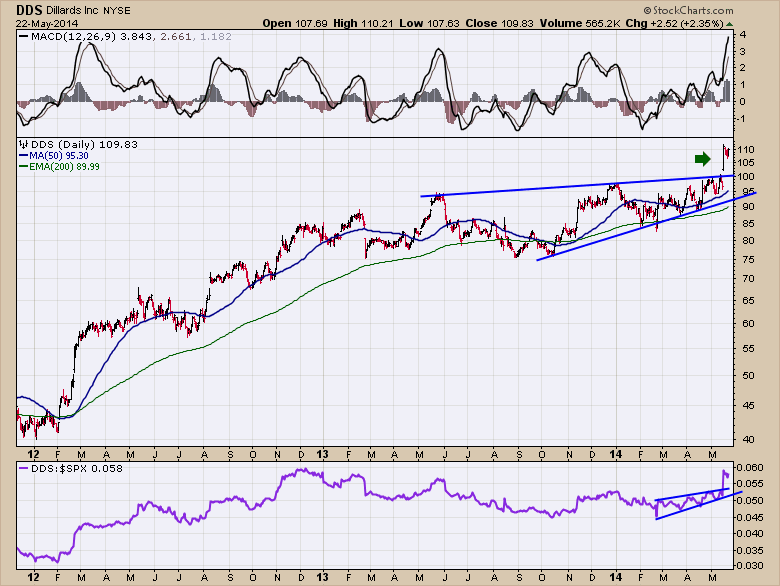
We can see the launch well above the uptrend line. This breakout was very substantial. That can only be described as bullish. Nice gap up and the stock is just consolidating since the gap.
Let's move onto a Washington State based retailer, Nordstroms (JWN). Nordstroms is the second retailer from the Apparel Retailer Industry rather than the Broadline Retailers.
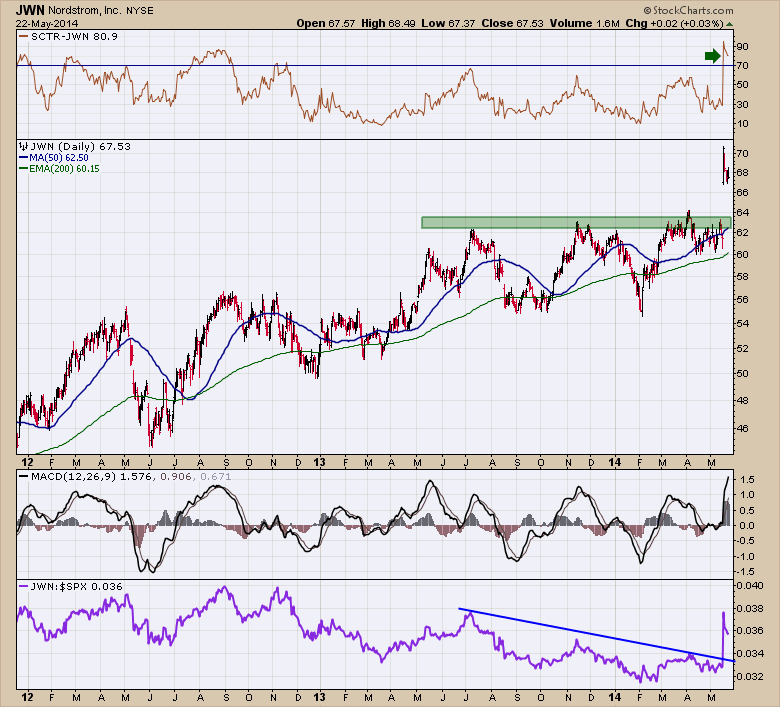
The chart is as bullish as the Dillards chart above. After pushing up against resistance at $63 over and over, it gapped up last week. It is consolidating after the breakout and jumped up into the top quartile on the SCTR rankings. It has mildly underperformed the $SPX for the last year but the stock just keeps chugging higher. Bullish.
That covers off the Large Apparel Retailers. Moving on to the long list of the Broadline Retailers, the charts shows some incredible changes from what you might expect. Lets start with one of the strongest retailers for the last 3 years. Macy’s (M) has been a true star for years now.
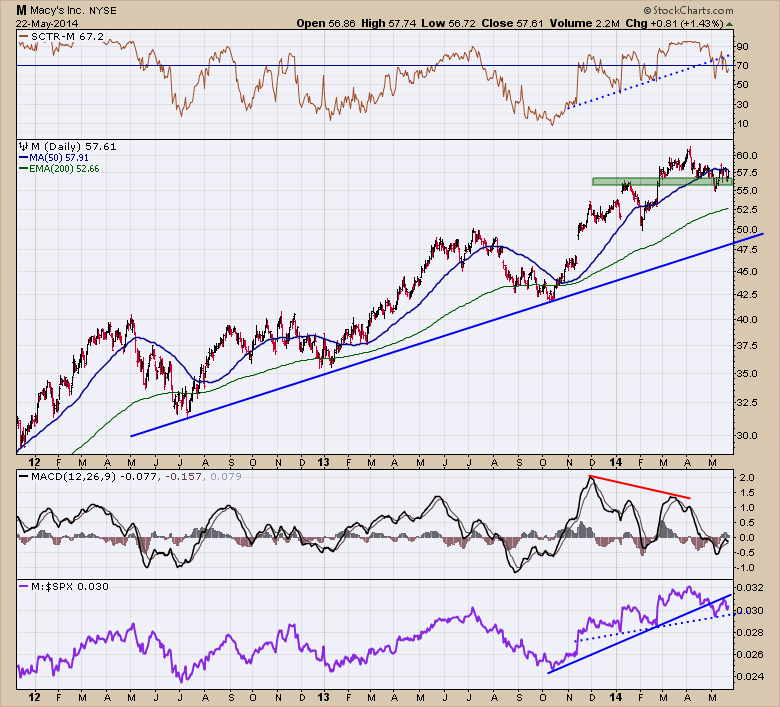
The SCTR has been rising for the last six months. Macy’s is holding support at $56-$57. Today it is trying to break out above the 50 DMA. Still in a long term up trend. In the very short term, the chart looks like it is feeling a little seasonal weakness.The negative divergence on the MACD is concerning as well. There is another relative strength trend line shown with a dotted line. Macy's is fine if support at $55 holds. The 200 DMA and the long term trend line are major support locations.
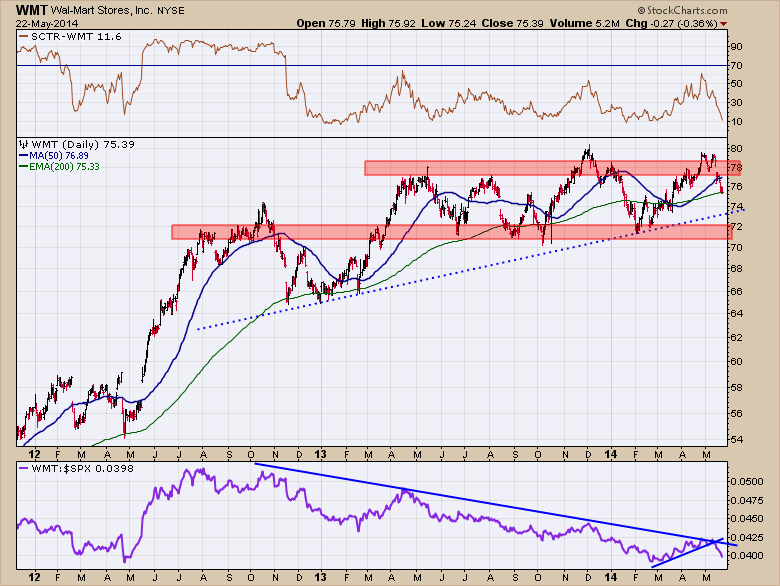
Wal-Mart (WMT) appears to be trapped inside a trading range. Currently the two pushes above the $79 level look like a double top. The dotted line up trend sits around $73. Wal-Mart is currently testing the 200 DMA. We can also see the relative strength of Wal-Mart has been weaker than the strength of the S&P 500. It recently just broke down again. At this point, the sideways range looks dominant to anything else. In early May I thought Wal-Mart might break out, but it rolled over. When Wal-Mart does outperform, it is usually a weak economic environment. So as long as Wal-Mart justs stays in the range, that will be ok. Target is our next focus.
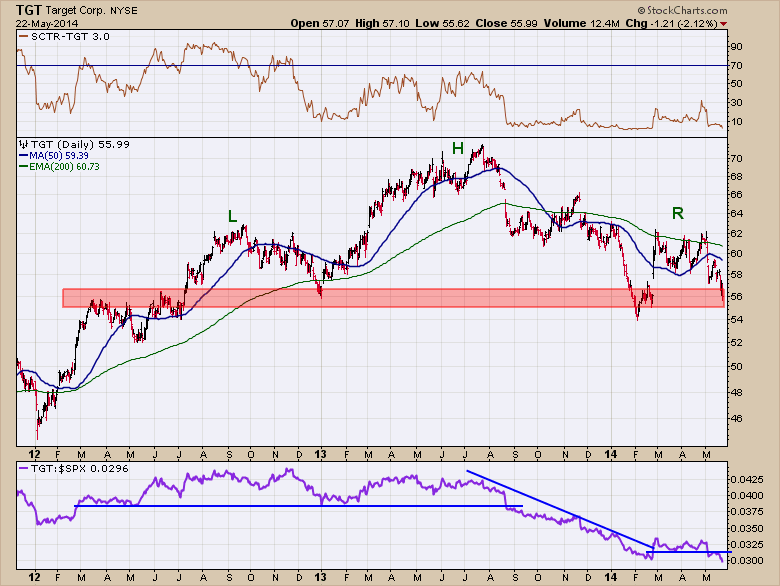
Target (TGT) has been struggling since the data breach. The SCTR ranking was in a continual downtrend for the stock, which is never good. For the past 9 months the stock has been in the bottom quartile. The chart appears to be breaking down significantly as the price action now appears trapped below the 200 DMA shown in green. The support level of $56 is a neckline for the head/shoulders pattern. This is a major topping structure and if it completes with a price breakdown below $54, a long term target for Target would be $42 based on a measurement of $14 from the Head to the neckline. The relative strength just broke down again. We can see the SCTR line broke down below 75 for months before Target topped.
The Costco chart is a big surprise.
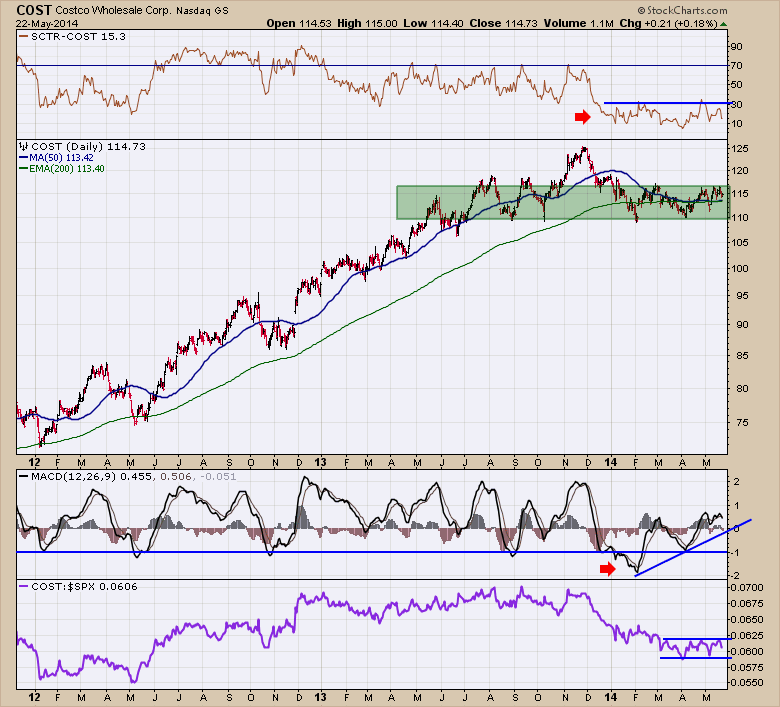
This fabulous retailer from Washington State has a weakening trend. The SCTR ranking is lower than it has been in 2 years. After residing in the top 30% of the stocks in its group, it dropped down in 2013 to be just average. Now it has moved down and appears stuck in this low zone. The Main price plot has significant sideways price action for almost a year, which includes a major bull market at the end of last year. Currently Costco looks like it is trying to break out to the upside by testing $116. It needs to break out. The MACD made a lower low than any time in the last 2 years which is concerning. The relative strength is important here. Costco has tracked sideways with the $SPX recently. If Costco can break out, this would be very bullish after consolidating for so long. Conversely, a breakdown below $110 would mark a significant shift in the sentiment towards Costco given the multi year lows in the indicators.
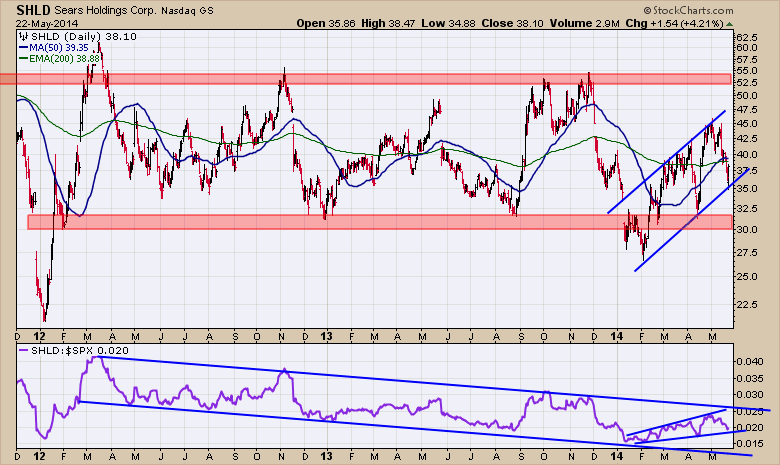
Sears Holdings (SHLD) has been going horizontal for almost 5 years with this lower range the last 2 years. This sideways channel seems to be holding the stock. Early this year the channel failed to hold. Since then Sears Holdings have had a channel going higher. This channel is powerful enough to make the relative strength line rise. At this point the direction of Sears Holdings seems sideways at best, but the failure of the channel in January 2014 to hold as support for Sears is a pessimistic signal until proven otherwise.
Sear Hometown and Outlet Stores (SHOS) IPO’d in October 2012.
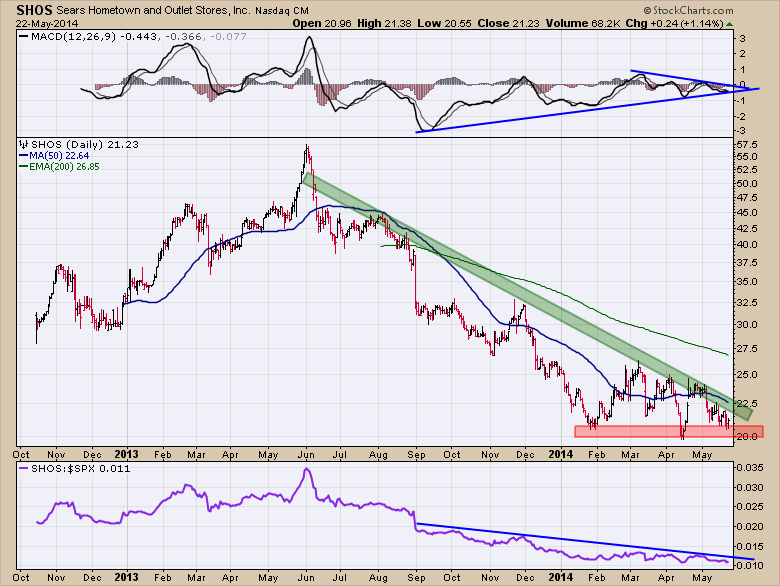
After a brief rise, Sears Hometown (SHOS) has moved down for a year. At this point it is trying to find support at $20. There is some positive divergence on the MACD but until price breaks a downward channel this looks like it is going lower. Hard to find a reason to buy it here until it breaks the downward trend.
Next is Big Lots (BIG).
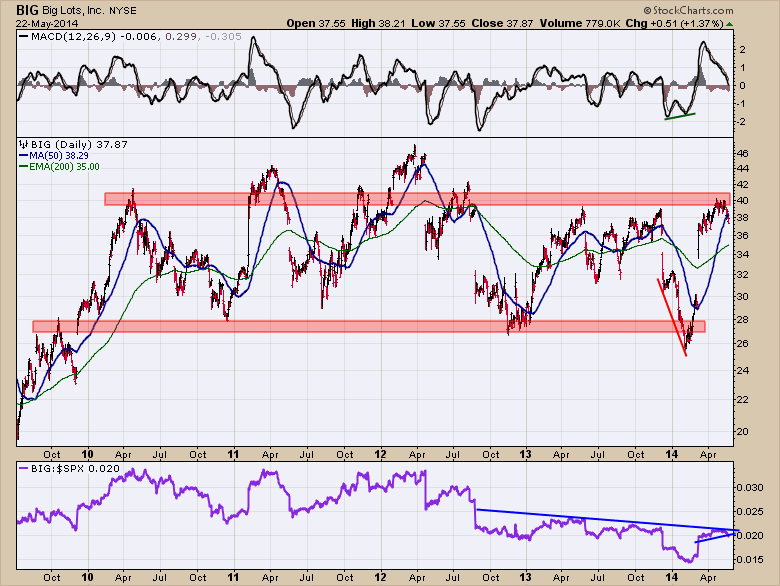
Big Lots has been in a sideways (dead money) trading range for 4 years. Notice this chart is double the time span of most of the charts. There is no new information on the chart other than the breakdown in January. The recent high was marginally higher than the two previous highs. The relative strength line continues to deteriorate.
Here comes the stock with a 32% short interest.
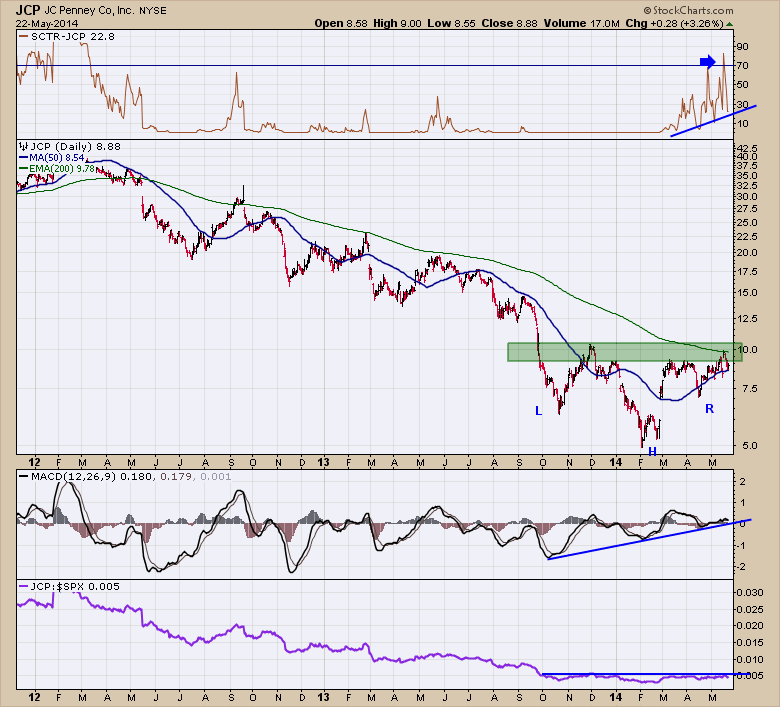
JC Penney (JCP) has to be the big, big surprise. The chart is finally waking up from a slumber. The SCTR is starting to show a heartbeat after laying at the lowest possible level for almost 2 years. JCP has doubled off its recent lows. The Head/Shoulders basing pattern is interesting and recently it tested the 200 DMA for the first time during a huge bull market. The MACD looks to be in a manageable uptrend. The MACD made a higher low while the price action made the final low. Nice positive divergence. Now the relative strength line has been mostly flat for 6 months. A strong break above here would really make this a nice base to build from. It looks like any break above $10 is a strong indication of new buyers coming in, which would force the short positions to cover. This stock could move quickly with those dynamics. If it just rolls over after setting up this nice base, it would probably indicate a retest of the $5 low if the gap at $7 does not hold.
Lastly, the online behemoth Amazon which is another Washington State retailer. Not living in the US, I find it interesting to see three large retail companies located in the Puget Sound area.
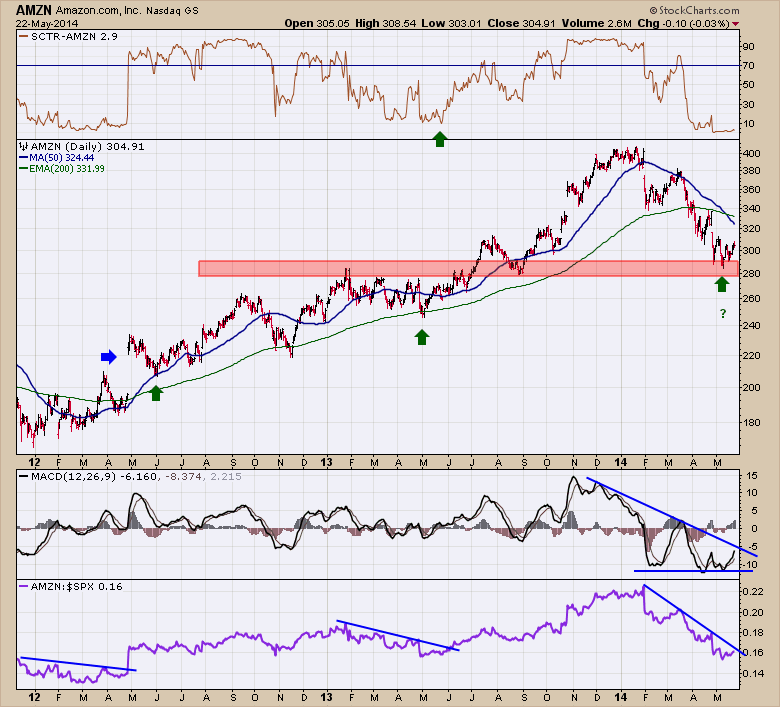
The SCTR for Amazon (AMZN) seems to make an annual trek to the low end of the SCTR plot. This $100 correction or 25% is meaningful. On the price chart, I placed green arrows at the May lows the last 2 years. Amazon made seasonal lows in May and proceeded to move higher for the rest of the year. The MACD made significantly lower lows this year which is concerning but it is creating nice divergence with the price action now. The MACD is not making lower lows with the price. The relative strength of AMZN has not broken out yet. Should it break out that could be a valuable signal.
In summary, the retailer charts for the largest and most renown companies in America all seem to be sideways as a group. Only 4 have any real positive spark currently. Many of them have a serious topping structure. Only JC Penney has a solid basing structure. It is particularly disappointing that a lot of the charts are back to year ago levels coming off the S&P 500 new highs last week. Some are at levels of 2,3,4 years ago. Only the top 3 charts are really nailing new highs.
Here is the Broadline Retailers Industry Group Chart.
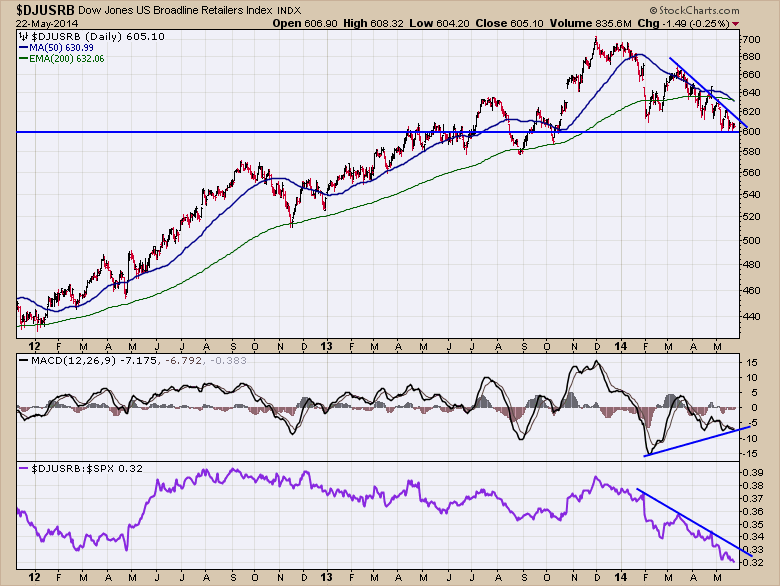
The $DJUSRB price is back to a year ago. The MACD has some positive divergence but until there are some upturns on the MACD marking the bottom of this momentum, that is a weak line to draw in now. The S&P500 Relative Strength (SPURS) is shown in purple. This industry still looks headed south and until some of these charts perform bullish breakouts, investors might be stuck in a sideways industry at best. AMZN is intriguing with the last 2 years having May lows before accelerating higher. JCP is intriguing but it might be at the expense of a Macy's If investors only want one stock for industry exposure. Costco, Target and Wal-Mart were underwhelming. They don't look ready for my money yet, but you can click on these charts to see current updates and perhaps the turn comes sooner than later. At least now we are prepared and we have a good understanding of the big store retail enviroment now.
Good trading,
Greg Schnell, CMT

