Well, there was not a lot of support on crude at $72. That was an area of interest but it clearly washed out. Now that the price has plummeted, it feels a bit like the aftermath of a weather disaster. When you look around you are amazed at the damage.
I am going to roll through the top 10 holdings in the iShares Canadian Energy ETF. (XEG).
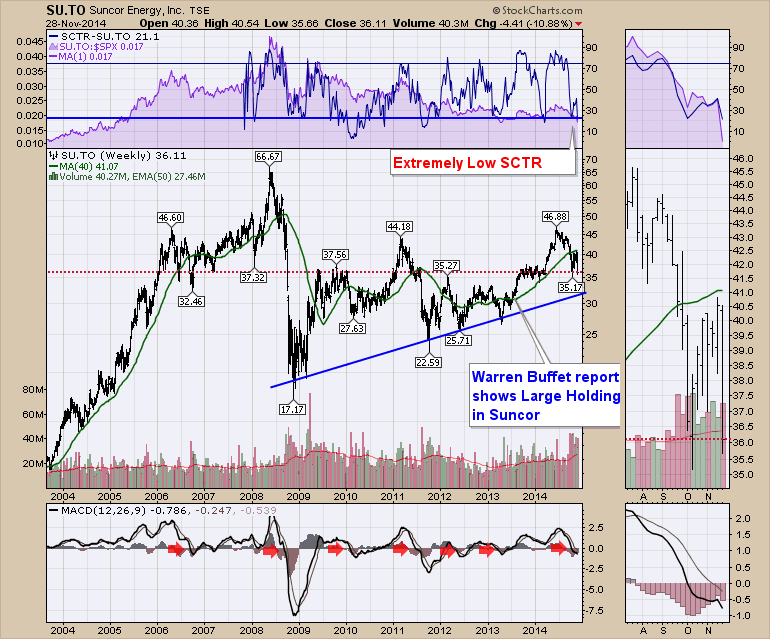
The order will be from the largest to the smallest holding. We start with Suncor (SU.TO). The SCTR is now in the bottom 25% of all stocks on the $TSX. While it is still going down, It might not be the opportunity to buy it but it is 20% above the area where Warren Buffett found value. I put the red dotted line at the closing price for November on each of the charts. Amazingly, look how much the current red line shows as a historical support resistance area. Other than the 2008-2009 low, Suncor builds V- bottoms, not rounded bottoms. Look at the volume piling on in the last 10 weeks. Sunoco also has a chain of gas stations (Petro-Canada) so the refining margins should be excellent while price settles. The price has fallen 29%.
Next is Canadian Natural Resources (CNQ.TO).
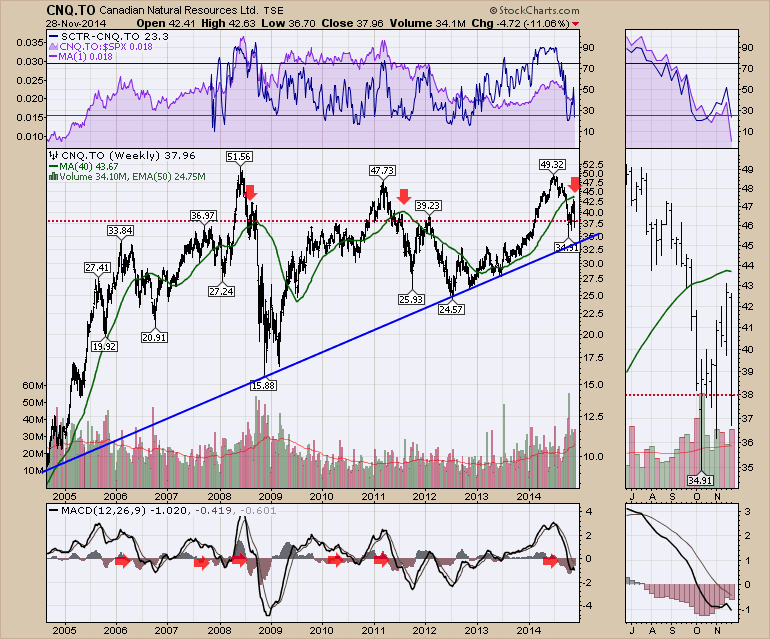
The SCTR is below 25 for Canada's second largest oil company. The purple area is the $SPX relative strength which I call SPURS. Every one of these charts is underperforming the $SPX as that Index is very near all time highs and these stocks are well below the 40 WMA. What is alarming on this chart is the three red arrows showing the stock price falling after breaking below the 40 WMA and then bouncing back up only to fail at that level again. Note the years where that phenomenon occurred in the chart. We are clearly in a major down trend when a stock cannot get back above the 40 WMA. The 10 year blue trend line would appear to be at $34.75. CNQ is 23% off the highs. Once again, the current price seems to be at a very interesting support / resistance zone. The volume is 50% higher than the 50 EMA.
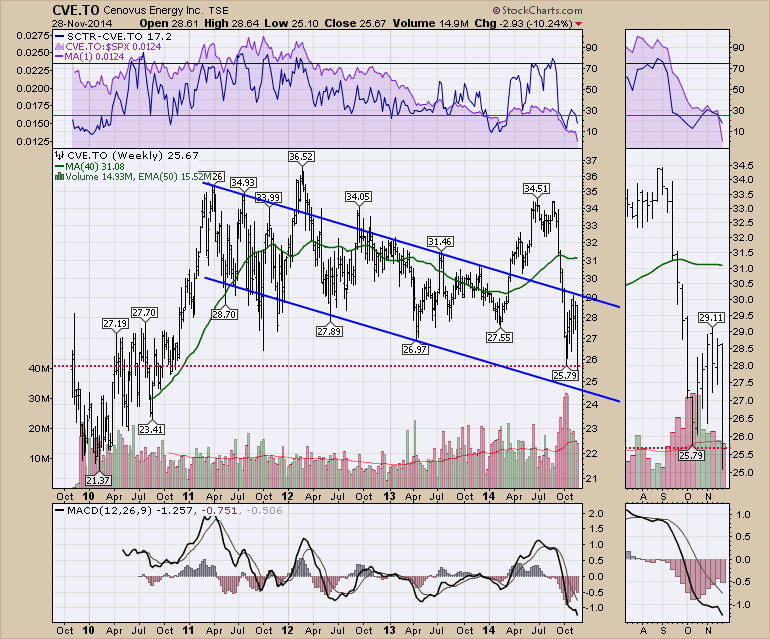
Next is Cenovus. (CVE.TO). Cenovus came on the scene as a split from Encana into an Oil company and Encana was to be the Natural gas company. Cenovus closed on a 4-year low to end November. The SCTR is under 20%. It is important to remember that the SCTR is a comparison to the other stocks on the Toronto Stock Exchange. With energy and mining making up 1/3 of the index, this has clearly dropped to one of the lowest considering its size. The stock has really been a choppy trader and is impaired by lack of pipeline access. They have some rail car loading facilities but this is difficult with low export access as well as falling crude prices. Quite frankly, they are a fantastic company with great progress. The production has tripled in 5 years from roughly 80,000 to 240,000 yet the stock is at 4-year lows. Wow. The stock is down 25% from the September high. The current price red line is only a fraction above where Cenovus started trading as a new company back in 2009. Cenovus is interesting volume-wise. The volume for the week was less than the 50 EMA and was the lowest volume candle of the last 10! The MACD is at the lowest level ever even though the price is only marginally low. Let's just say there is no momentum.
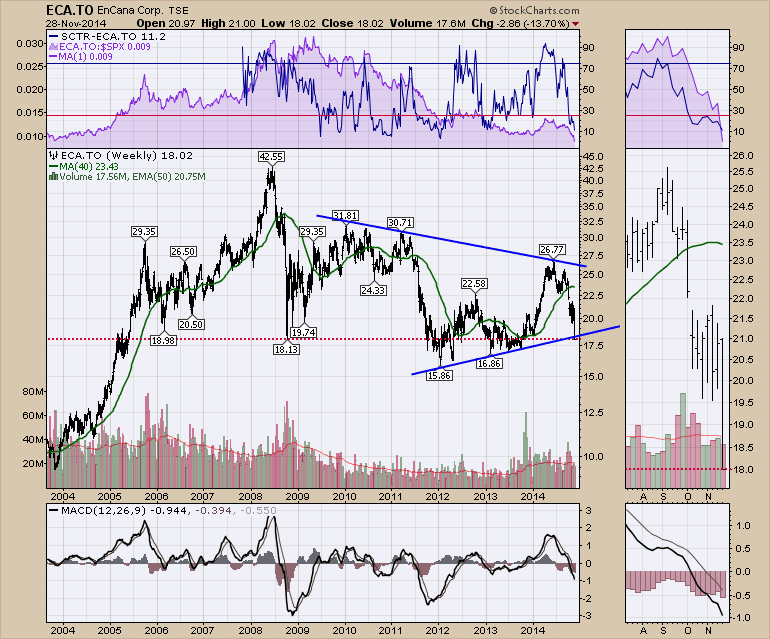
Next is Encana. (ECA.TO). What a chart. As Canada's 4th largest energy company it has been a tale of pain for investors. The July high is a long way from here. The price is down 32% from the highs or 48% above here. We can see we are near the 4-year lows for this stock as well. Even though Natural gas is well over double above the 2012 $NATGAS lows, Encana's stock price is only a few dollars above the same Natural gas low. The SCTR is back in the terrible zone at 11. The price closed to test the up trend line. Even when management was struggling to turn the ship around a year ago, we are back to the same depths of despair. Encana's volume has been below average for the last 5 weeks and the volume on the price plummet was low.
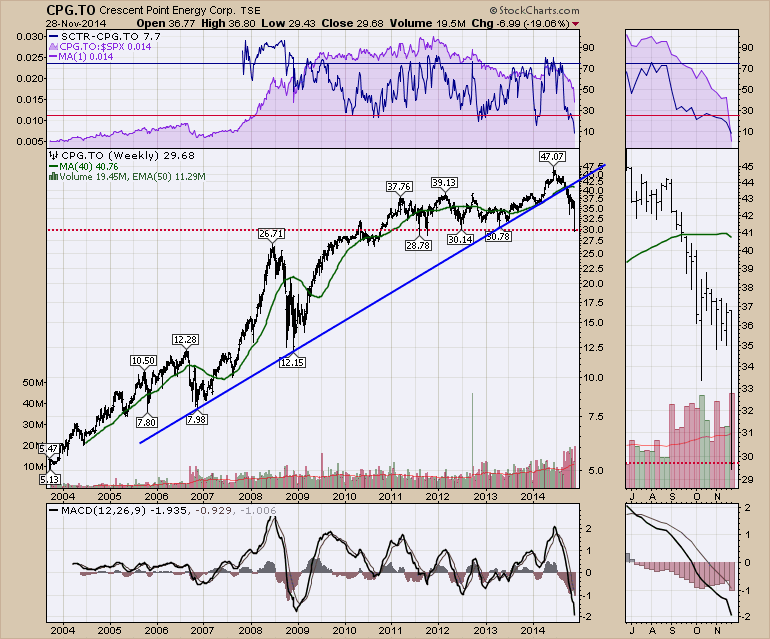
Next is Crescent Point Energy. (CPG.TO). The SCTR Is at its lowest level ever. 92% of the stocks are outperforming Crescent Point. The stock is 37% off its highs of June. The current price is at a major support / resistance zone and we snapped the 10 year uptrend a few months ago. This horizontal support area is very important. There is a little support around $26 and not much till $20 which would be the support area for the 2008 highs and the resistance area for the 2009 lows. Volume was a full 80% higher than the 50 Week EMA. The MACD is very low but because it is price based, it should not be confused with the low of 2009 because that was at a significantly lower price. However, it is still severe.
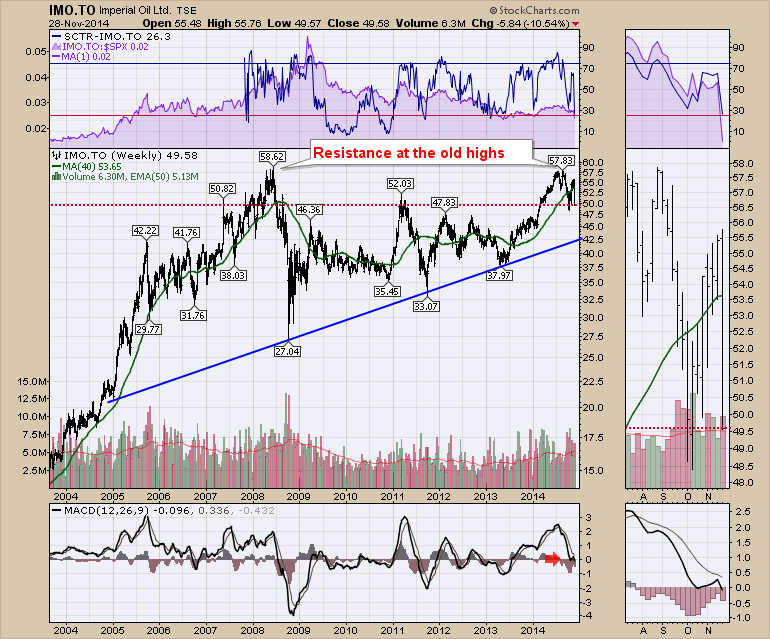
Well, that was the top 5. OUCH!!!! Let's move on to the next 5. Imperial Oil (IMO.TO) is next. Imperial is the Canadian arm of Exxon Mobil. They own a retail chain of stations called ESSO. As an integrated oil company, it should have refining margins to help protect it. Oh yeah they do. Look how strong this chart is considering the pullback in Crude. The stock is only down 14%. Once again the current price is hanging at a major support/resistance area on the chart. The volume is big on the last candle, coming in about 20% above the 50 EMA. The MACD is going below zero this week.
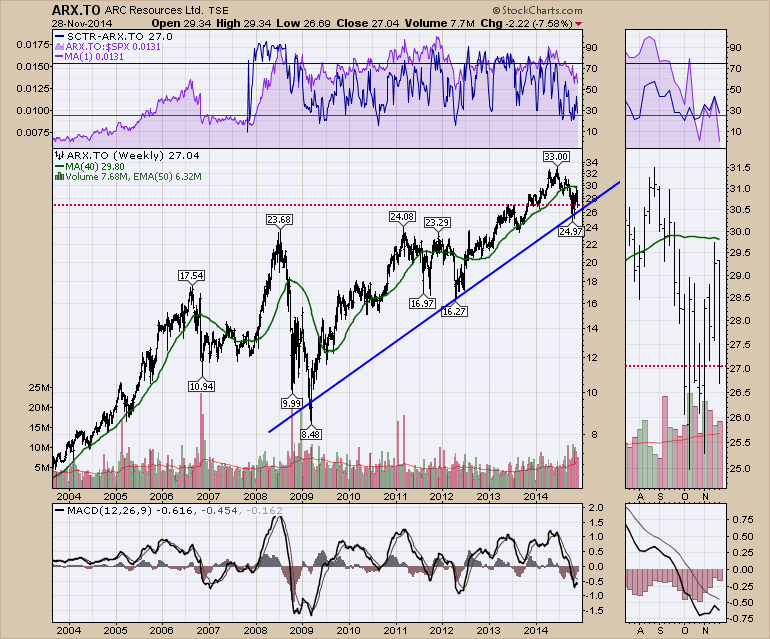
ARC Resources (ARX.TO) is 7th on the holdings list for the XEG.TO energy ETF. Oops. This one never got the memo. The SCTR is still at 27 which is no great shakes but it is clearly better that what we have seen. They do not have a retail network so this is outstanding for an oil and gas producer. The stock failed last week at the 40 WMA. The stock had a beautiful run above the 40 WMA which had been support since 2012. After pulling back below it and then trying to bounce back up through it, it failed. That is an important technical signal. The shareholders seem in no rush to sell this one. The pullback so far is 18% and the volume was above the 50 WMA but there are 5 bigger volume candles in the last 12 weeks.
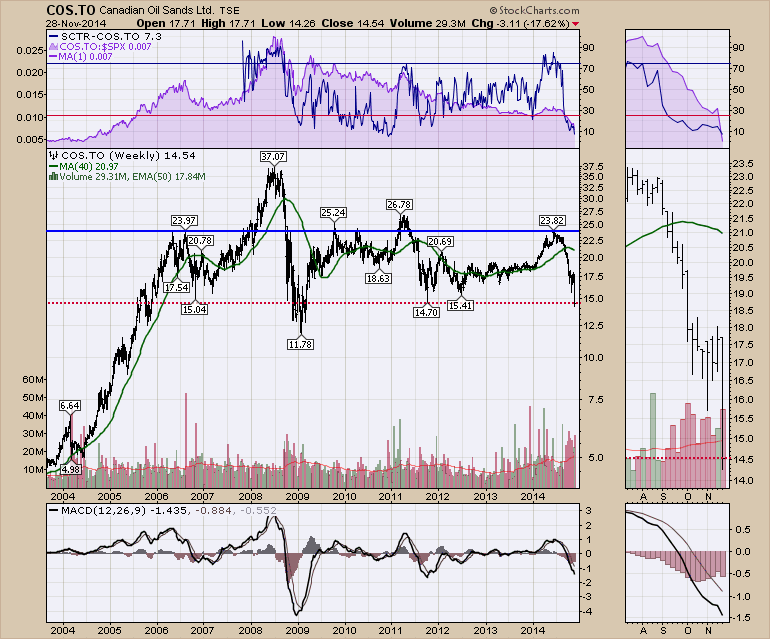
Canadian Oil Sands (COS.TO) chimes in at number 8 on the list. Wow, what a difference between ARC Resources and Canadian Oil Sands. This one has pulled back 39% since June. Now COS.TO has broken through the bottom of the 5 year range. The MACD looks severe and the volume was one of the largest candles on the recent cluster but this stock has a history of very high volume weeks. Just glancing at the volume cluster, this appears to be the heaviest period of outright selling in 10 years as even the volumes around the 2008-2009 period did not pile up like this.
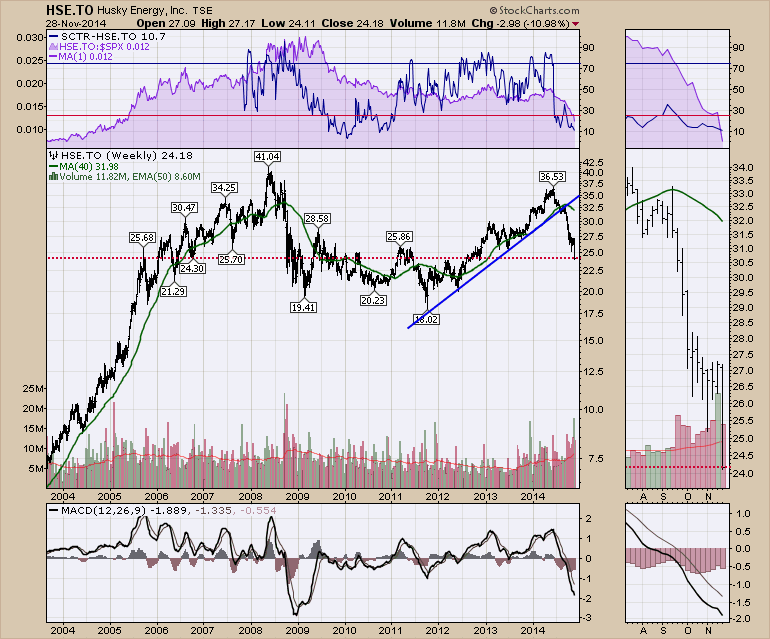
Husky Energy (HSE.TO) rolls in at number 9 on the list. Even though this company has a retail network by the same name, the stock appears unsupported by the retail. It is down 34% from the June highs. The price rose for almost 18 months from this level and gave it all back in 6 months. Once again, the price has settled at long-term support/resistance. The volume cluster is huge right here with this week's volume about 30% higher than the average. In the zoom panel, you can see the retest of the 40 week and a fail. The MACD is obviously beaten down and the SCTR is only at 10%.
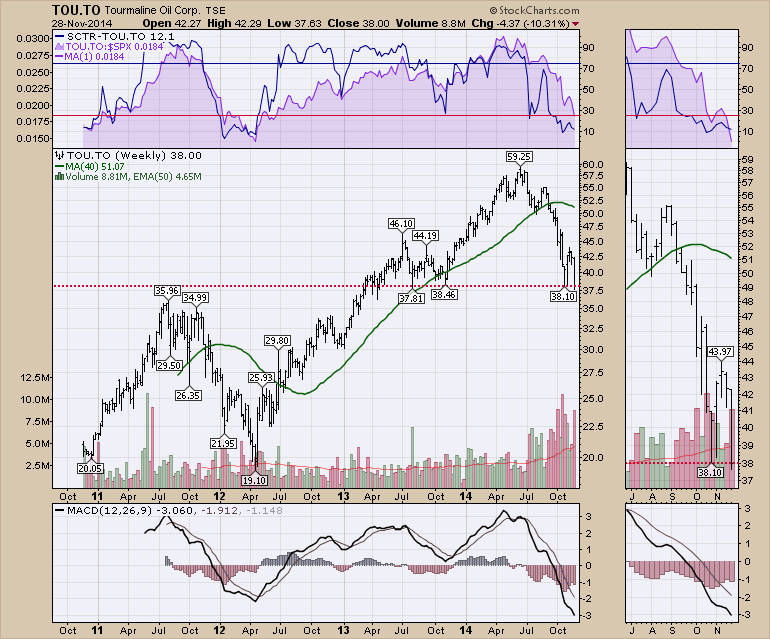
Lastly in the top 10 is Tourmaline Oil. (TOU.TO). This one has all kinds of technical data hanging. The price has come down to the recent support levels. The closing price has it holding above the 18-month lows. The intra week low of $37.63 drops it below the July 2013 low. There is some support at the $35- $36 level going back to the 2011 high. 39.18 would be the midpoint of the all time high and low. Here we sit just under that level and it is also sitting at the most obvious support/resistance zone on the chart. After a 200% run from April 2012 to April 2014, we have a 50% pullback. We can see the volume cluster is the largest in the history of the stock with repetitive weeks marking 3-year highs in volume. The volume this week was almost a double of the 50 EMA.
That rounds out the top ten. The carnage is immense. 5 of 10 are at prices that their respective stocks were at from 2006! The price of Oil is back to 2006 levels, so maybe that makes sense, but most of these companies are delivering big production increases of their production levels in 2006. Tourmaline is 50% off in 6 months. The charts of ARC Resources and Imperial Oil are remarkable in their chart strength. The top 6 trade on the NYSE as well. The tickers are the same without the .TO. ARC Resources, Canadian Oil Sands, Husky and Tourmaline are Canadian only.
The President of CNRL (CNQ.TO) is quoted in this Financial Post article as seeing oil going to the $35 level. Wow. Financial Post.
So in summary:
Suncor Down 29%.
CNRL (CNQ). Stock down 29% from the highs of 2014.
Cenovus Stock is down 25% from the September high!
Encana - Difficult times. Stock down 37% in 6 months.
Crescent Point. 2010 - 61,000 Barrels/day. 2014 - 136,000 Barrels/day. Stock Price $30 in 2010 and now. Down 37% from its highs.
Imperial Oil Price is at $50 in 2007 and 2014. Stock down 14%.
ARC Resources only down 18%.
Canadian Oil Sands Down 39%.
Husky, down 34% from the June highs.
Tourmaline down 50%.
I don't know where it will end. Who am I to disagree with Murray Edwards, the Chairman of CNRL? If oil can drop another 50% from here, that will be huge. I do think some bounce is in order, but in 2008 it just kept falling week after week. Some of the biggest ones have just started the fall from their 200 DMA. Another great technician suggested there could be a 12-18 month period before the sector is investable. Wow. All I know is the support at $72 did not hold. The size of the candles this week looks like an extreme that could create a low. Many don't think so. I'll leave how to trade it to you, but maybe it's like Thanksgiving electronics sales. They are definitely on sale, but they could be even cheaper next year.
Good trading,
Greg Schnell, CMT
