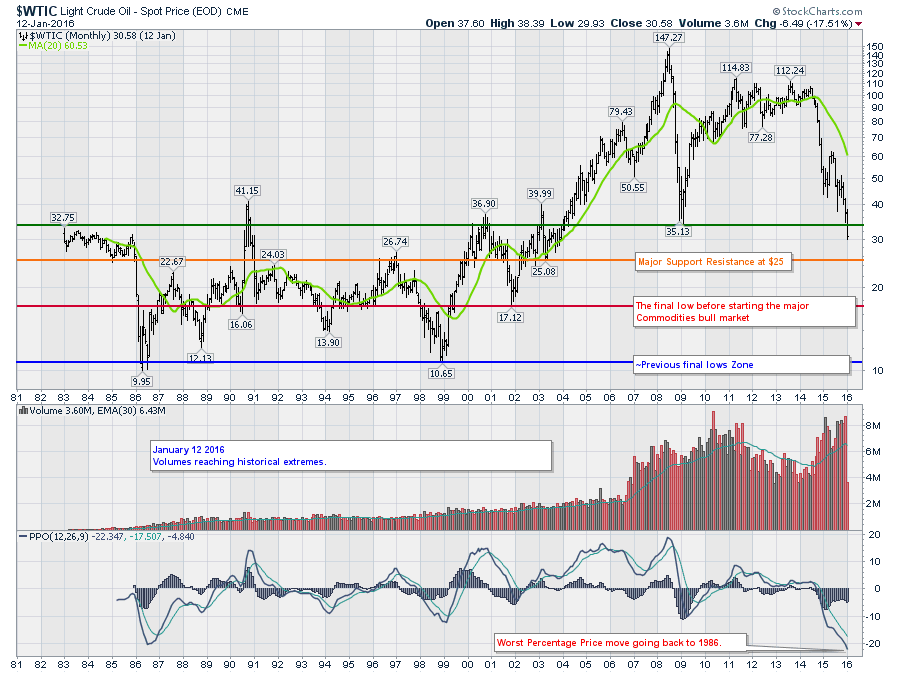
Here are the charts I think are the most important from the Canadian Technician Webinar! Well, wouldn't it be very Canadian to start the first webinar with a chart of Crude. Let's do that.
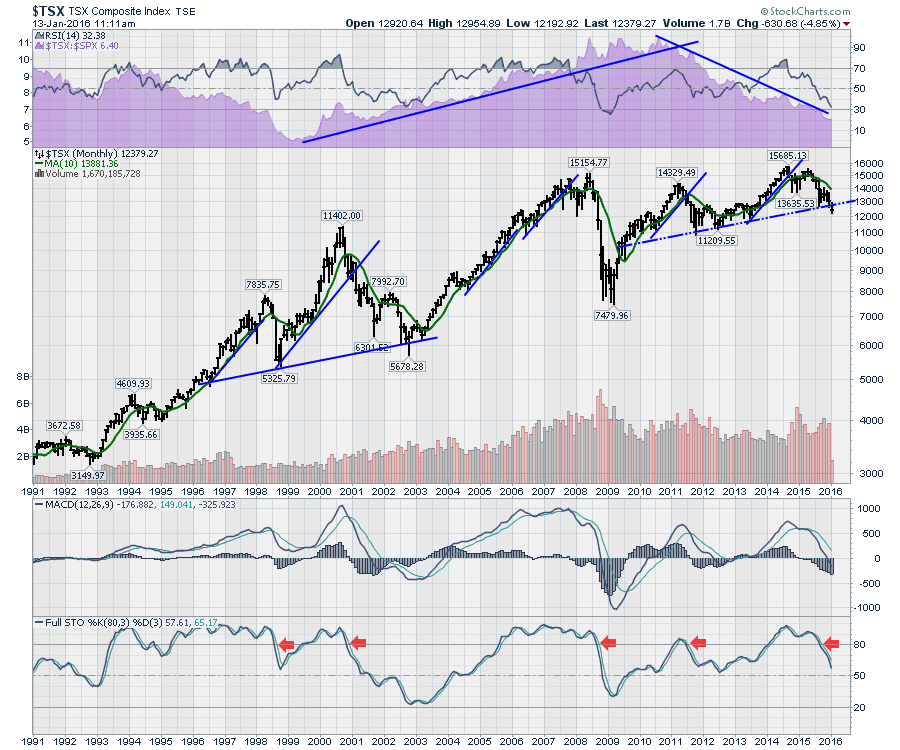
The Toronto Stock Exchange has clearly broken the support on the monthly charts. The RSI is reaching 30 on a monthly chart! That's a crazy level of oversold. I do expect some bounce through earnings.
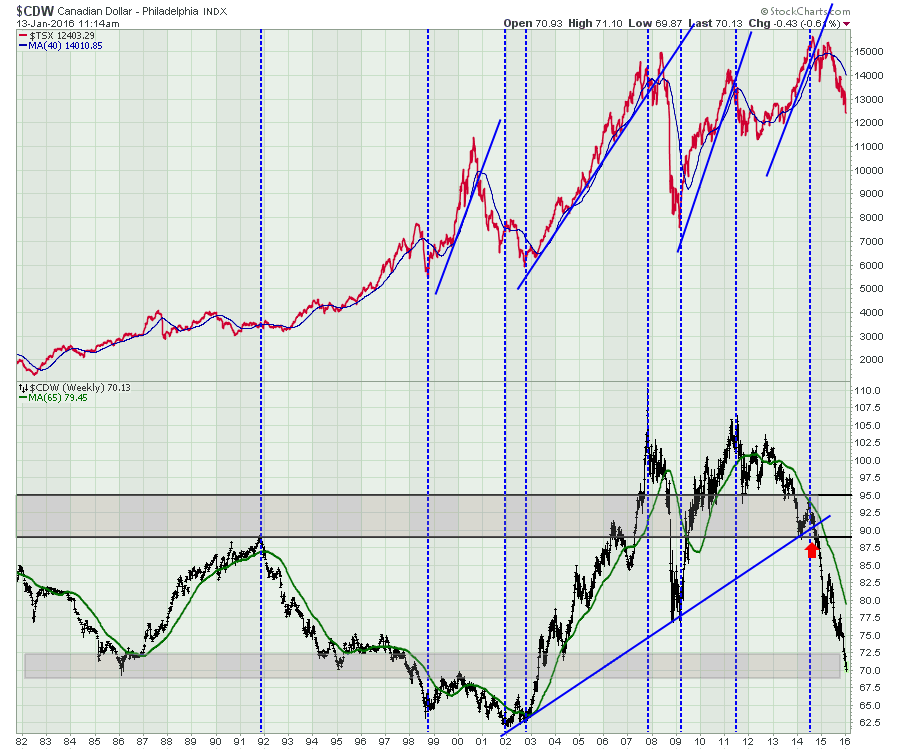
The Canadian dollar dipped into the 69 level for the first time since 2003. The blue vertical lines show major directional changes on the Canadian Dollar and the corresponding effect on the $TSX. A directional change in the dollar would probably change the direction of the $TSX.
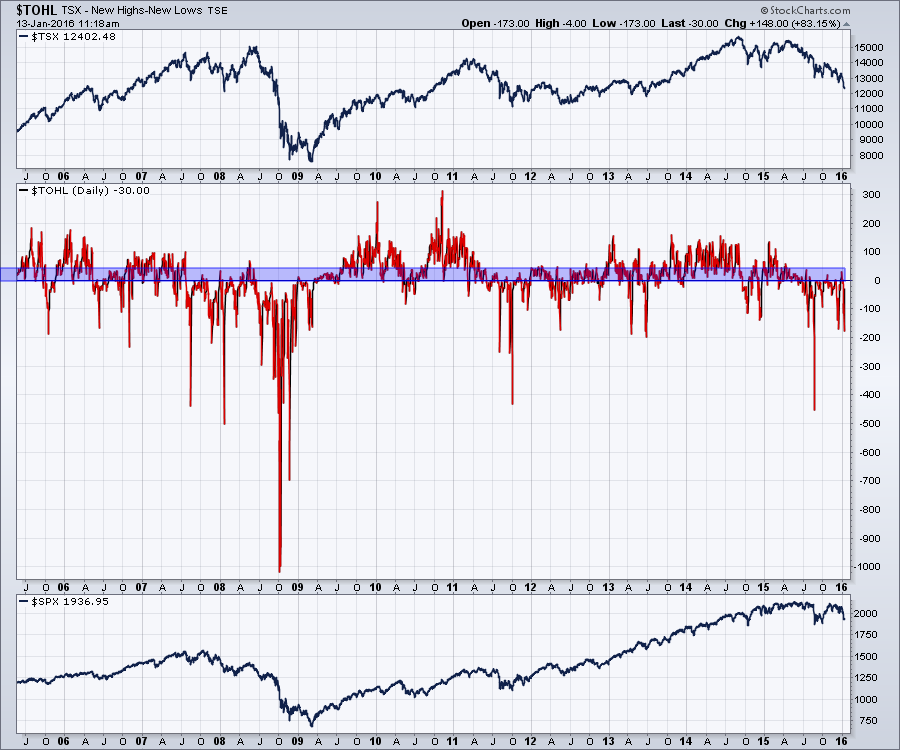
This is the New Highs - New Lows. We can see the chart is showing a severe level so some bounce should show up soon. I have shaded the blue area. You can see that when we can't get this ratio to hold more than 50 new highs compared to new lows, the $TSX is falling or sideways at best.
Here is the Bullish Percent index for Canada. At 30%, it is about as low as it gets without a Lehman Brothers moment. It doesn't have to bounce, it can stay here. However, the 30% of the stocks that are on a buy signal, are mostly in Utilities and Consumer Staples.
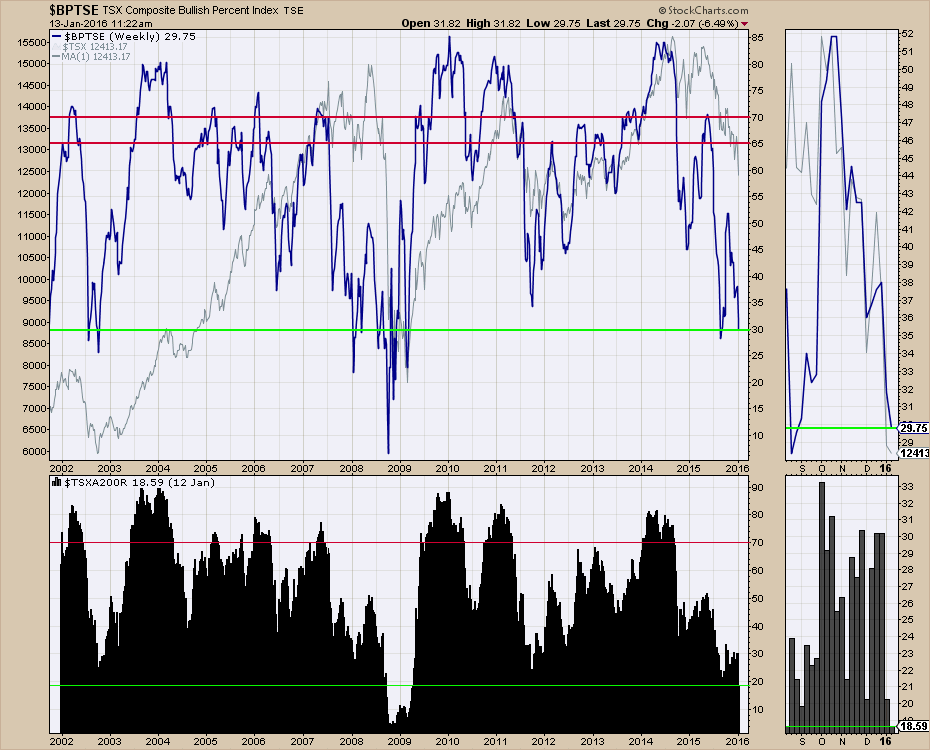
In the bottom portion of the chart above, you can see that the Canadian market has only had this low percentage of stocks (18%) above the 200 DMA at the end of the week once before. That was after the Lehman moment. Last Friday's close in the zoom box was slightly more than 20%. It's time to look for things to buy, but I would suggest staying in the Consumer Staples and Utilities for now.
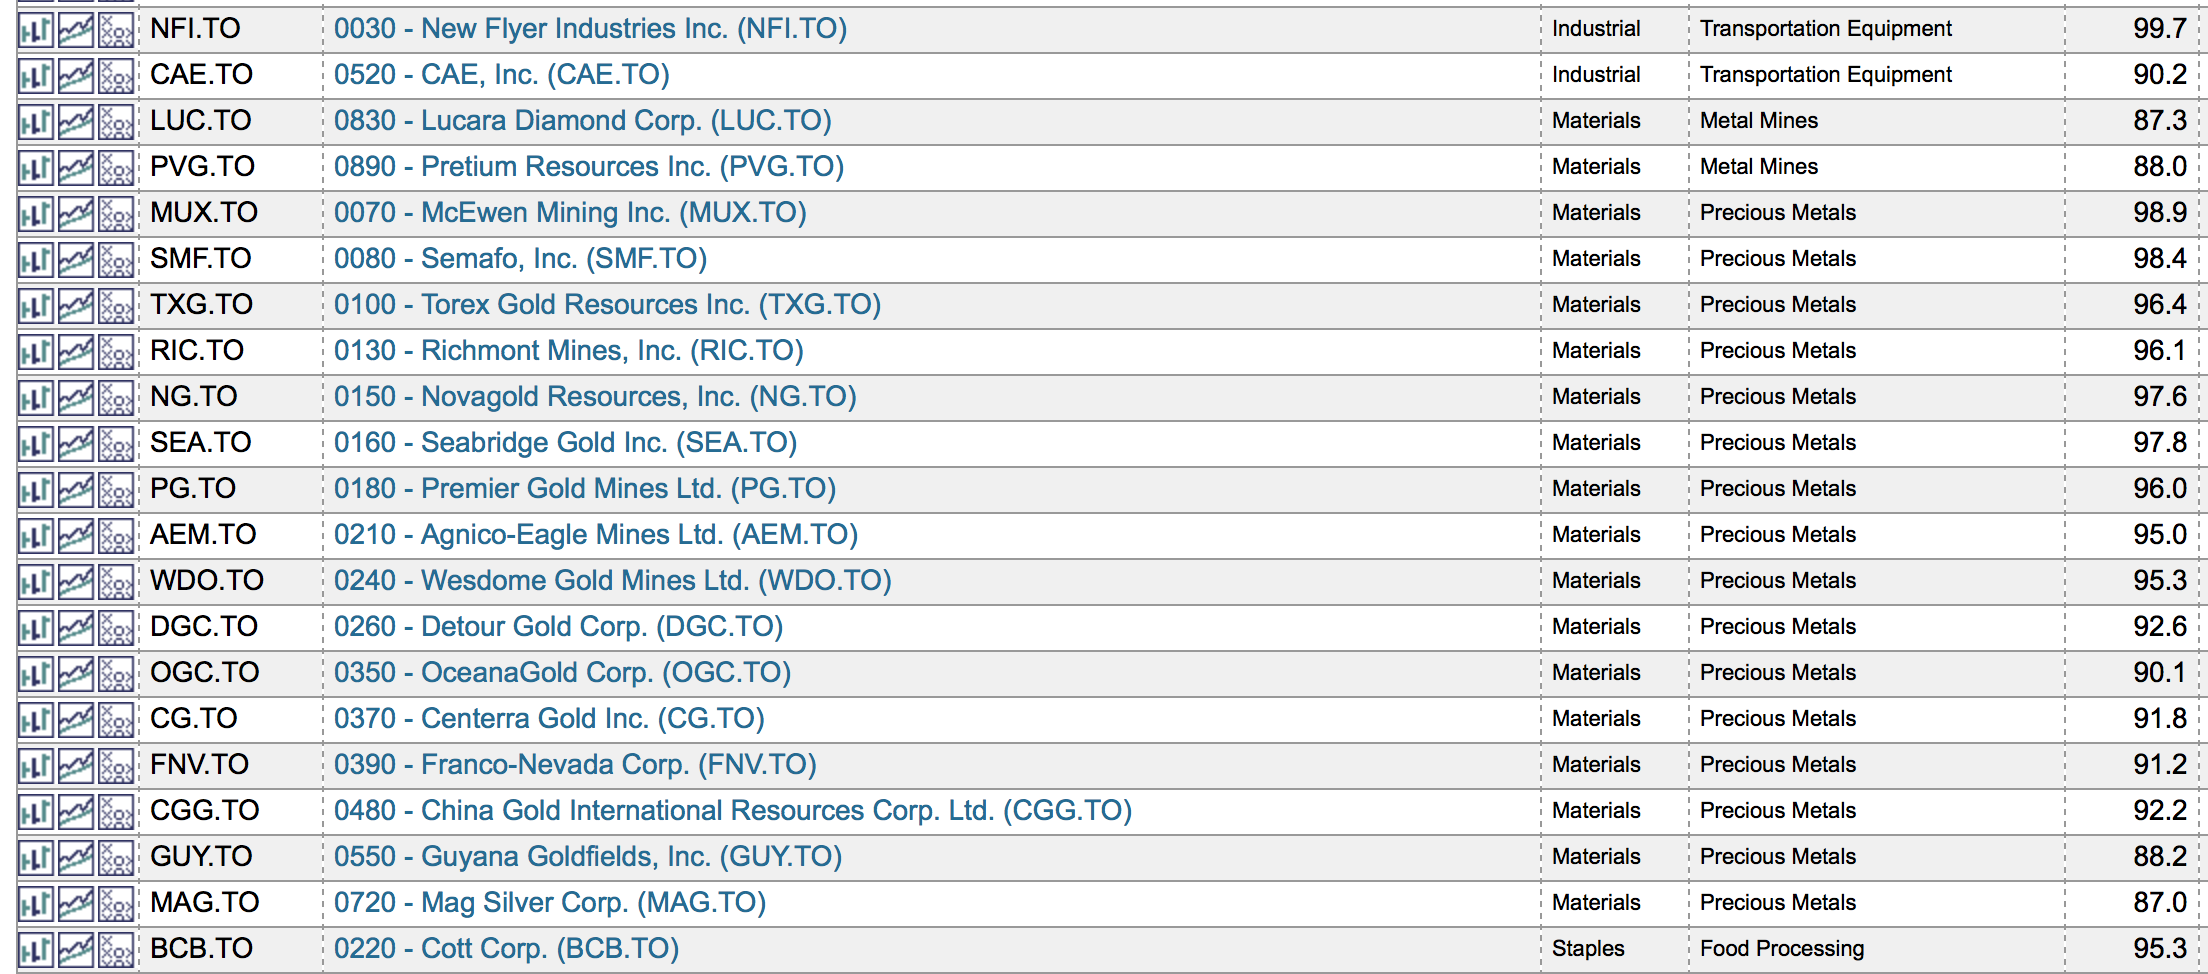
Lastly, we ran some scans. One of the things that showed up was about 15 gold stocks with SCTR's above 75. The Gold stocks are currently pulling back. However, investors should watch closely for a change to the upside. There is more information on my Commodities Countdown article. Here is the link to that article.
If you would like to listen to the webinar, here is the link. The Canadian Technician 20160112. I will be hosting the Commodities Countdown 20160114 Thursday. Click here to register.
Other Trivia: You can follow me on Twitter @schnellinvestor. You can also feel free to click the yes button at the bottom of these blogs to get an email when they are updated. You can do that for all the blogs on StockCharts.com
Good trading,
Greg Schnell, CMT
