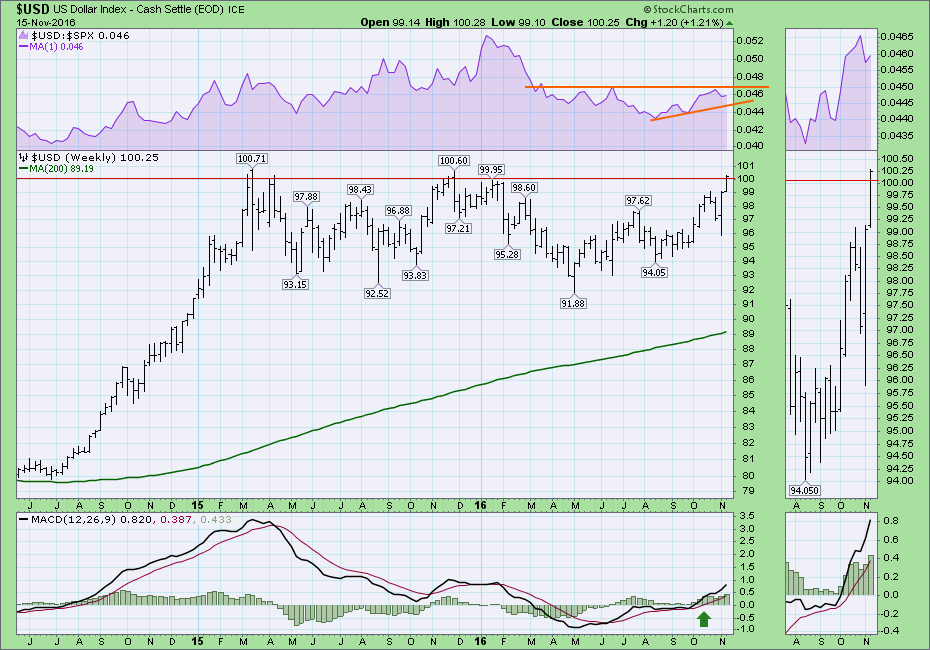
For Canadians, one of the most important aspects of our economy is the close relationship we have with our neighbour, the United States. Understanding where the US Dollar is going is a large part of the Canadian investor's landscape. So today, the US Dollar Index ($USD), an index created from a basket of 7 currencies, closed above the highest weekly close in the last two years (red line) but not quite above the intraday highs. So this is a major two year resistance.
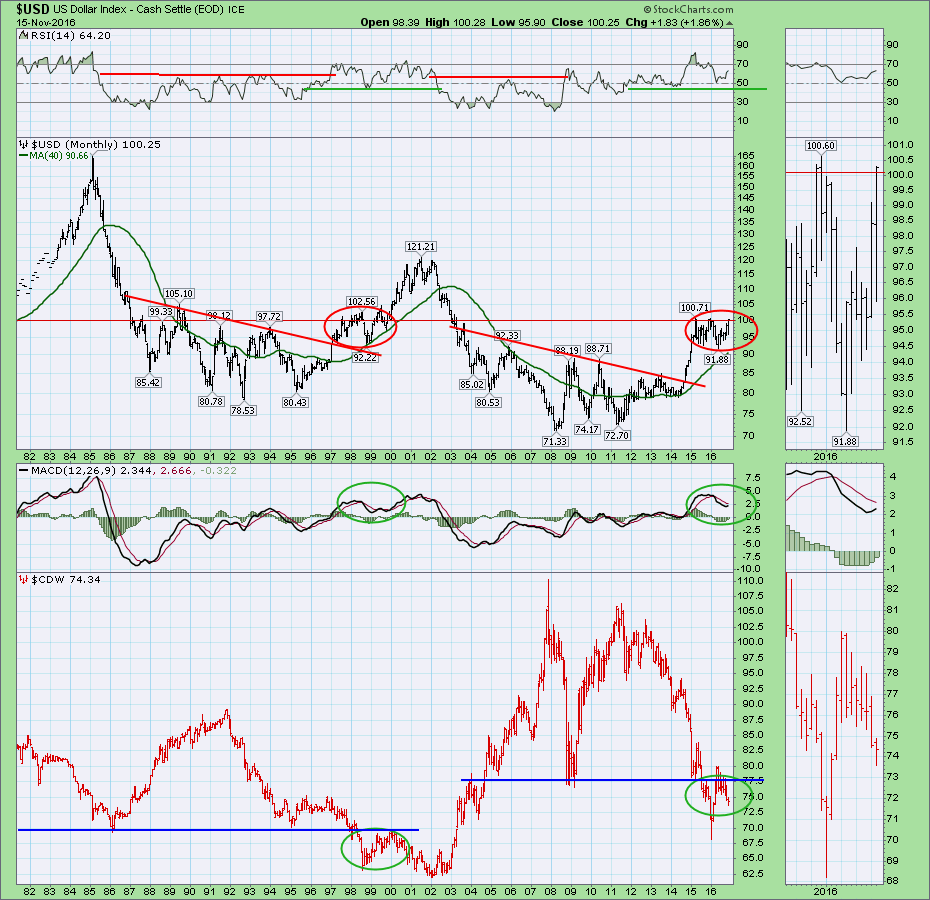
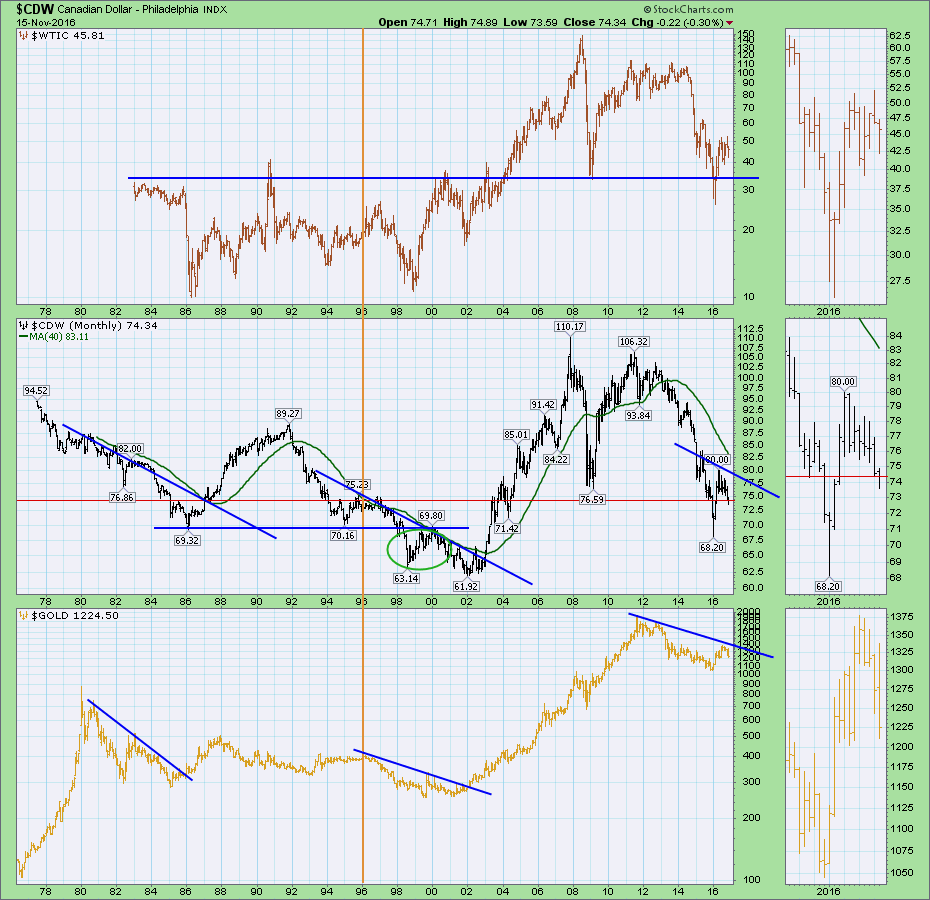
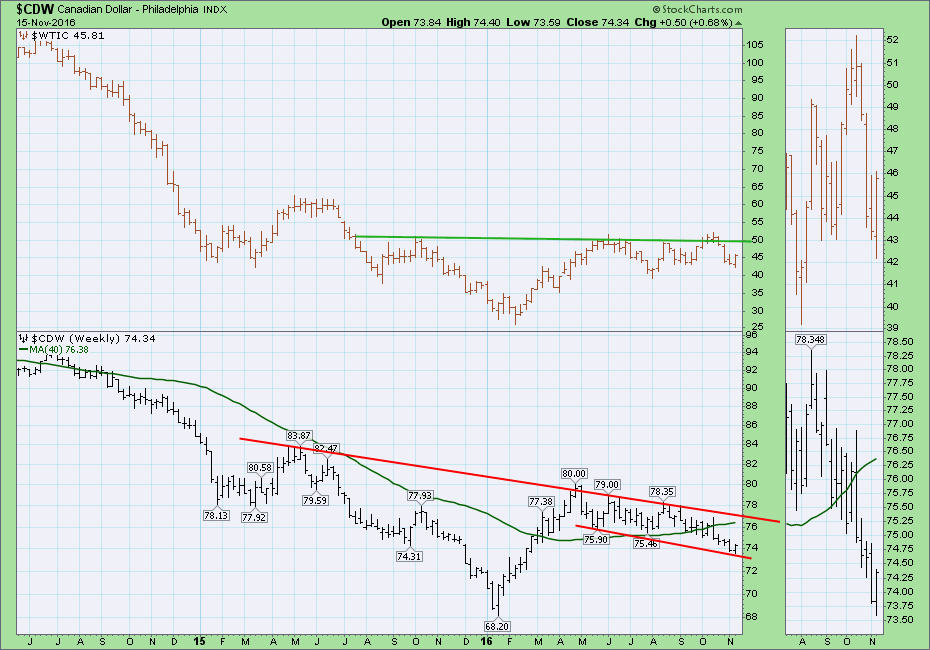
On Chart 1, relative to the Canadian Dollar ($CDW), the US continues to go higher and the Canadian Dollar lower. However, the Canadian Dollar tracks Crude Oil ($WTIC) or visa versa. They have a tight correlation. On Chart 2, I have shown the two together. It's not the same in amplitude, but the general trend seems the same, most of the time.
Looking at the US Dollar ($USD) over a longer period, we have seen a similar setup in the Dollar before. Amazingly, the current chart has a lot of similarities to the 1996-1999 period. The monthly RSI is behaving in a bull market pattern. The MACD below the $USD is also showing the same market rhythm. In the 1990's, the price was held under a downsloping trend line until the breakout in late 1996, early 1997. Then the chart consolidated inside the ellipse for about three years and then roared upward for almost two years. Those same traits currently exist now but we have only consolidated for 2 years. So one of the major questions needs an answer. Will this be stall at resistance, will it be a false breakout after two years, or are we on the way to the big breakout?
 For the Canadian Dollar ($CDW), we have a very similar setup to the US Dollar as well. What was interesting last time was the Canadian dollar did not pull back very much after breaking support and finally putting in a low. The retest of the low was relatively close to the initial low. That might suggest the $CDW chart finds support testing the January lows around 68. While the market never plays out exactly the same, it is important to keep in mind the potential for the $USD to soar higher. Chart 2 shows $WTIC tracking the Canadian Dollar pretty well. Let's review that chart over the long term as well.
Since 1996, Gold, Oil and the Canadian Dollar shown below have tracked each other quite closely. While each swing may have had different amplitudes, they coincide with some margin of overlap. This is an important time for Canadian investors as Oil and Materials make up 1/3 of the $TSX.
 On the webinar, I spent some of the time to try and explain how important the next few days would be for investors. One of the traits of a broad bull market rally would be to see other markets in the world follow the US to new highs. The Shanghai ($SSEC) is trying to do the same. I think you will find the webinar an interesting perspective as to why the opportunity to evaluate the strength of the market after the Trump Jump is upon us now.
The Canadian Technician LIVE! with Greg Schnell - 2016-11-15 17:00 from StockCharts.com on Vimeo.
I will be continuing to analyze the broader global picture on the Commodities Countdown Webinar 2016-11-17. While the US market is making new highs, the Canadian market has not been able to push to new 2016 highs. Please join me on the webinar by registering. Follow this link. Commodities Countdown 2016-11-17. I also post a group of charts that may be of interest to you that you can glance at anytime. Greg Schnell's Important Charts.
Thank you for following this work. You may subscribe to this blog by clicking the Notify Me button below.
Good trading,
Greg Schnell, CMT, MFTA.


