While the market awaits the Federal Reserves decision to raise interest rates next week, lots of things are happening under the surface. The bullish moves in the marketplace are now happening in the defensive sectors and we are seeing more and more information creating a warning for the market cycle.
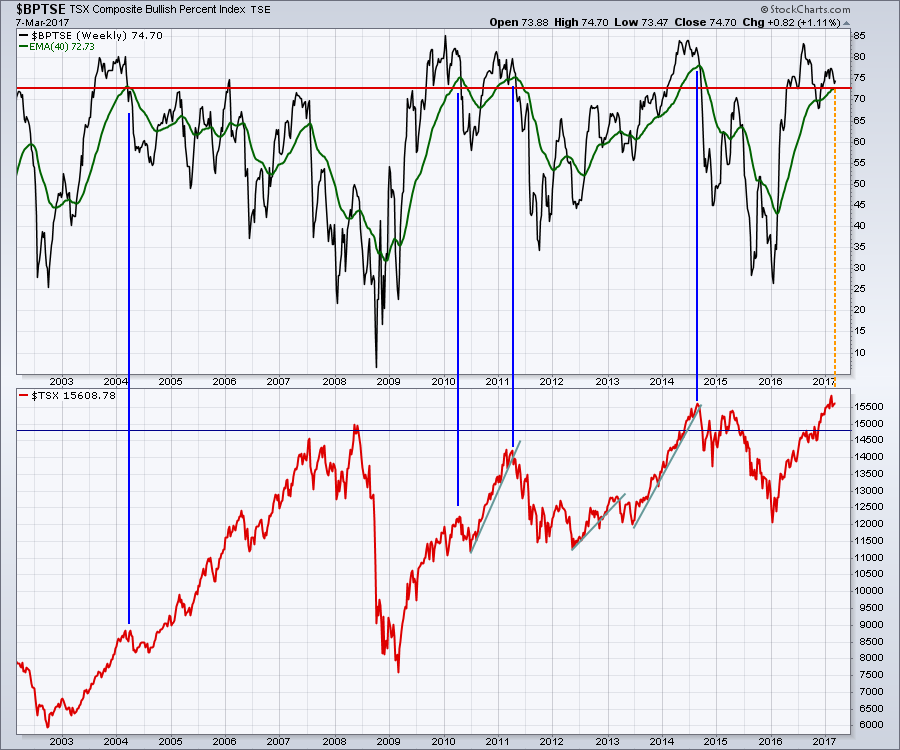
Here is a picture of the Bullish Percent Index (BPI) for the $TSX ($BPTSE). The point I would like to make on this chart is where the BPI crosses the 40 WMA at a very high level, the 4 previous corrections have been at least 5%. In a roaring bull market, that is not so bad but it is nice to be aware of the potential setup. I have drawn the red horizontal line at the current BPI level and the blue lines show the timing on the $TSX when the market crossed down below the 40 WMA from these lofty levels. The other thing to notice is the market does not hold this level of Bullish consensus. You can see the $BPTSE has not spent a whole year above the 68 level since we started recording the data. The 2013-2014 period was close but that had QE Infinity in play at the time.
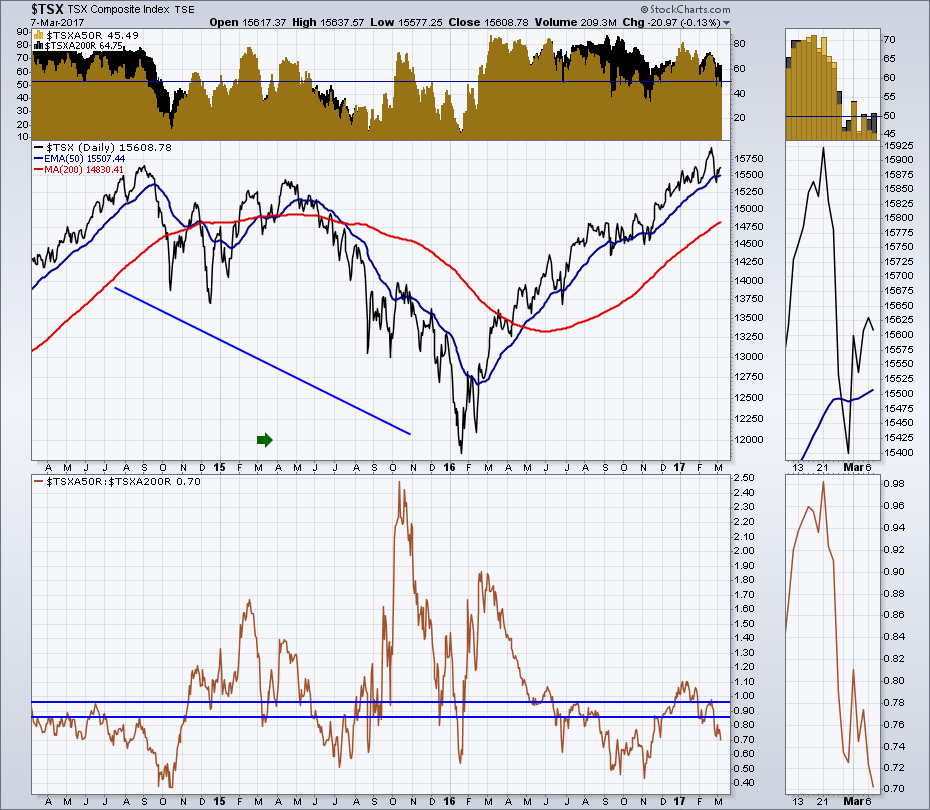
There are a lot of charts breaking trend lines down right now. Less than 50% of the stocks are above the 50 DMA shown in Gold. On the background in black, this shows 65% of the stocks are still above the 200 DMA.
This weakness is starting to show on the chart comparing the percentage of stocks above the 50 DMA with the percentage of stocks above the 200 DMA ($TSXA50R:$TSXA200R). When this ratio in the lower panel moves below .85, this is a warning condition that the breadth is thinning.
 I spent a portion of the Canadian Technician recording outlining the stocks that are working. The real issue is that most industry groups only have a few stocks outperforming. The banking sector has been performing better than most. The other areas of the financials are starting to move down the SCTR rankings. Normally we like to see entire industry groups doing well. There is very little to choose from right now if you like industry group support for the leading stocks. Almost every thing is in the financials sector and the banks just finished reporting earnings. It's hard to diversify from that currently.
But some of the independent stocks look intriguing. As an example of interesting stocks, here are two below.
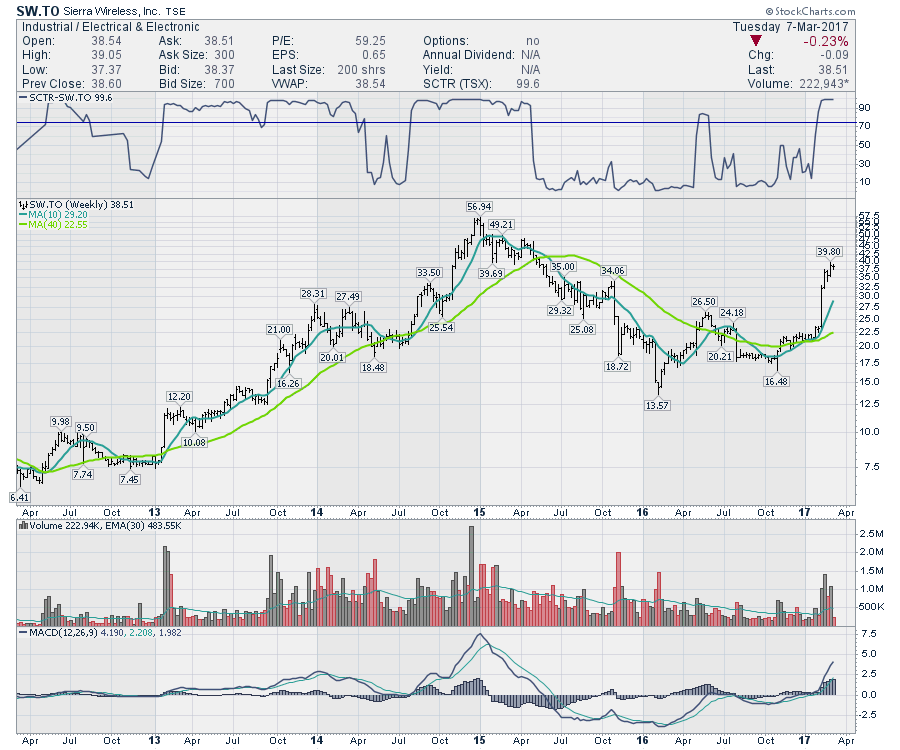
Sierra Wireless (SW.TO) looks to be changing direction here with the Internet of Things (IoT) Technology. Hard to buy it right here with a 70% move in 4 weeks, but looks great for putting on a watch list. If the overall market corrects, we might get a better opportunity.
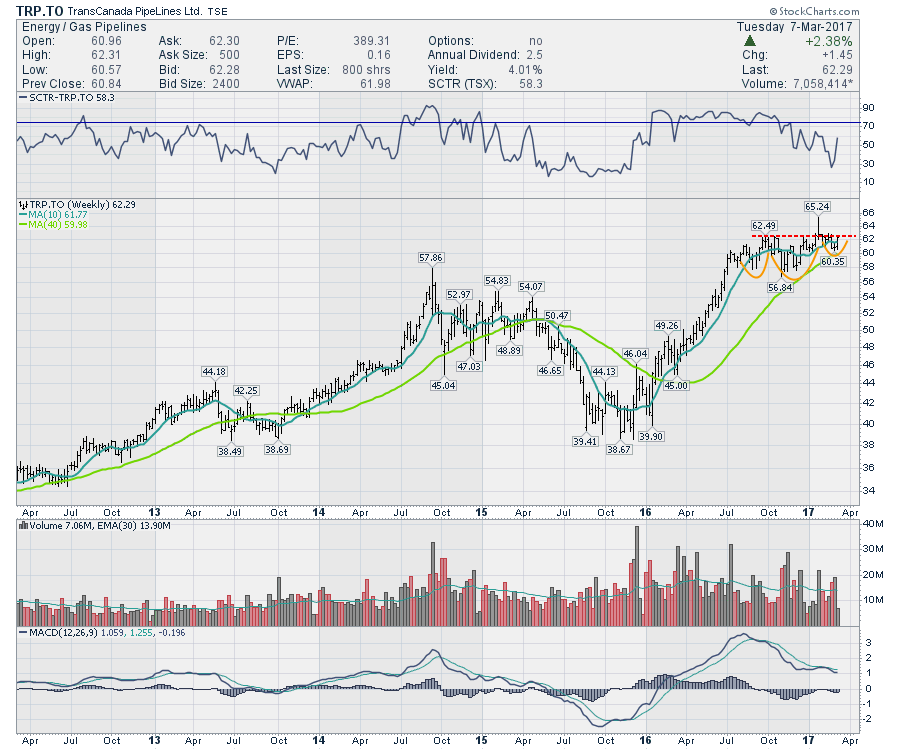
 Another stock that is still in it's trading range is TransCanada Pipelines (TRP.TO, TRP). The MACD is still declining, but a breakout above $63 is pretty interesting. So far this week, the histogram likes like its making a smaller dip than November 2016. Perhaps this sets up for a nice entry.
 I am very uncomfortable owning the commodity-related stocks here. The Industrial Commodity group looks weak and the whole industry was pushing down hard today. The oil related trades have been out of favor for a while. For an in depth look across the Canadian sectors, here is a link to the recording.
The Canadian Technician, Greg Schnell 2017-03-07 from StockCharts.com on Vimeo.
The bottom line for me here is being very cautious on Canada. Commodities rolling over is not a bullish condition for the Canadian market. I'll have more information on the Commodities Countdown recording on Thursday.
For the educational component, I want to focus on the little chart on the home page called Today In The Market:
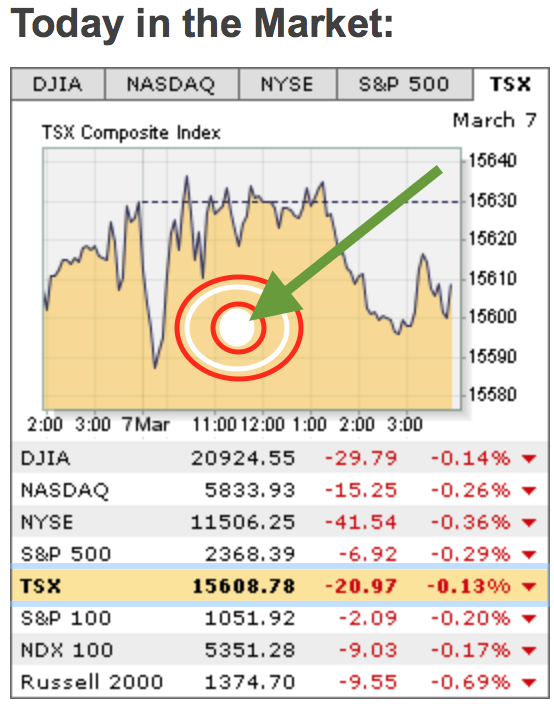
Quite a few people don't realize they can click on either the tabs or the line to change the chart image to a different index. In this case, I have clicked on the $TSX line to see the $TSX Composite Index image.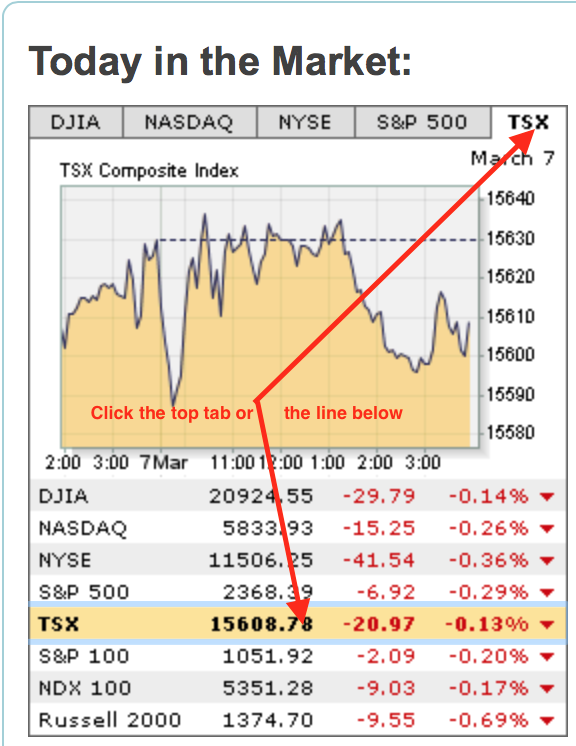 But wait, there is more. If you click anywhere on the actual chart image, members will go to the Gallery view with an intraday chart, a daily chart, a weekly chart and a PnF chart all displayed on one page. This is a super nice tool to quickly see the different time perspectives. You have to click on the chart image to get this four chart setup!
 Try it out and you'll see this very easy to use link giving you fast access and bringing you up to speed on the market.
Good trading,
Greg Schnell, CMT, MFTA.


