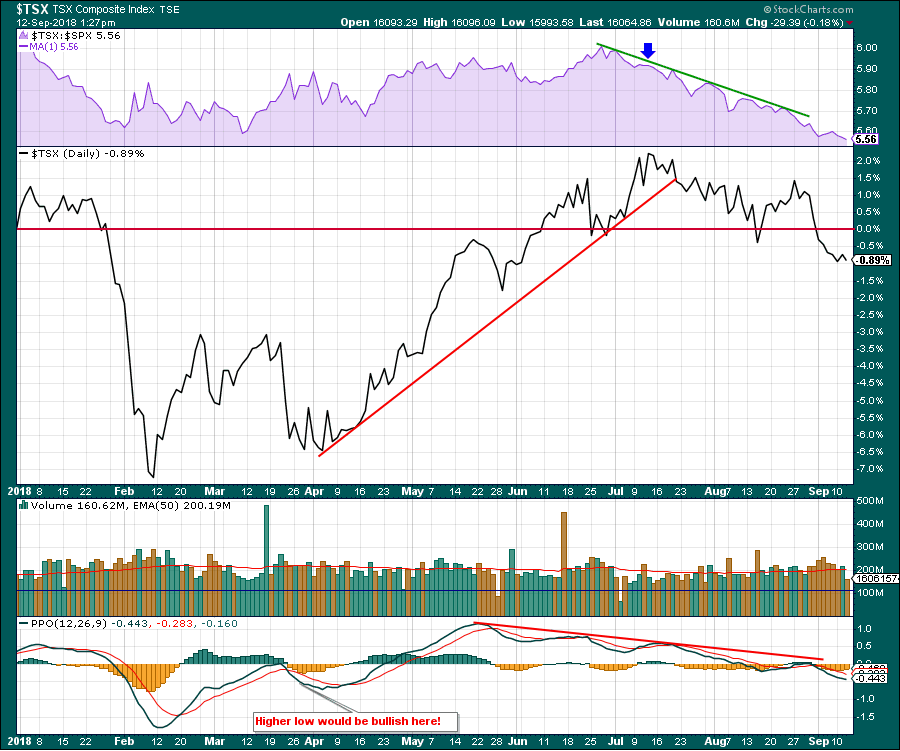
The $TSX is negative for the year.
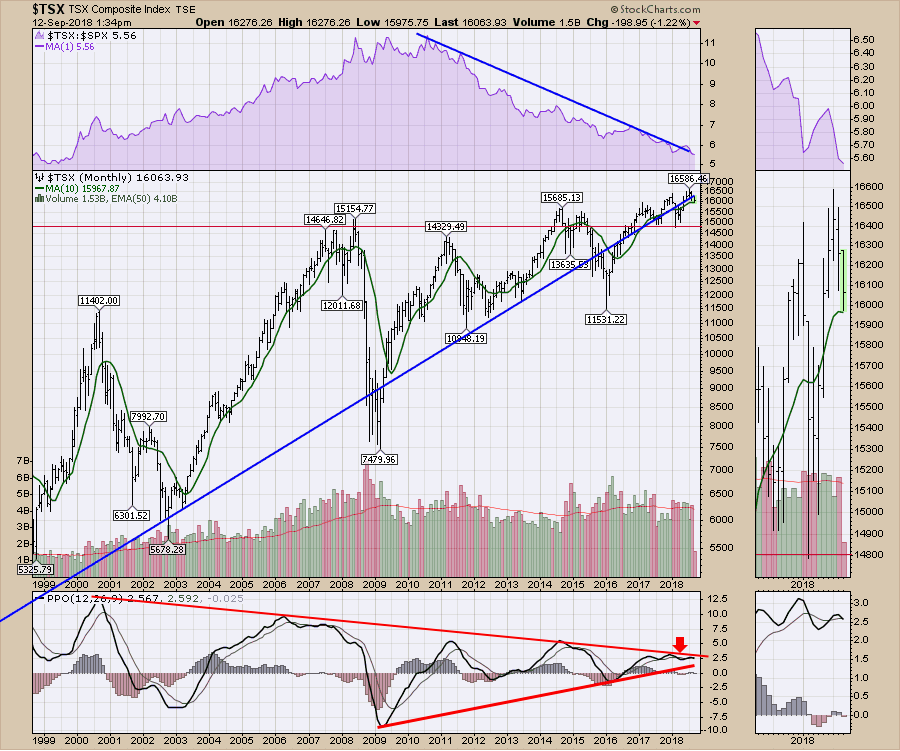
The monthly chart of the $TSX made a lower high and a lower low in August. 1/3 of the way through September, we have lower highs and lower lows than August. A series of lower highs and lower lows is the definition of a downtrend. This can be seen in the zoom panel. We have been flirting with this long uptrend line shown in blue. This month it looks like we are breaking below the line again. The line shows the Canadian stock market unable to accelerate above the line like it used to do. In the zoom box, the PPO looks to be giving a sell signal. We have to wait for month end to confirm the signal, but monthly sell signals are pretty telling. Notice in 2006 we got a sell signal, but it took a few wobbles before the market broke down. Maybe we'll be fortunate and get more time. The other examples were very timely.
 It's hard to time the market with the monthly chart. Take a look at the weekly. At the annual CSTA meeting in June, the chart suggested that the upside was limited for the $TSX. A black arrow is placed there.
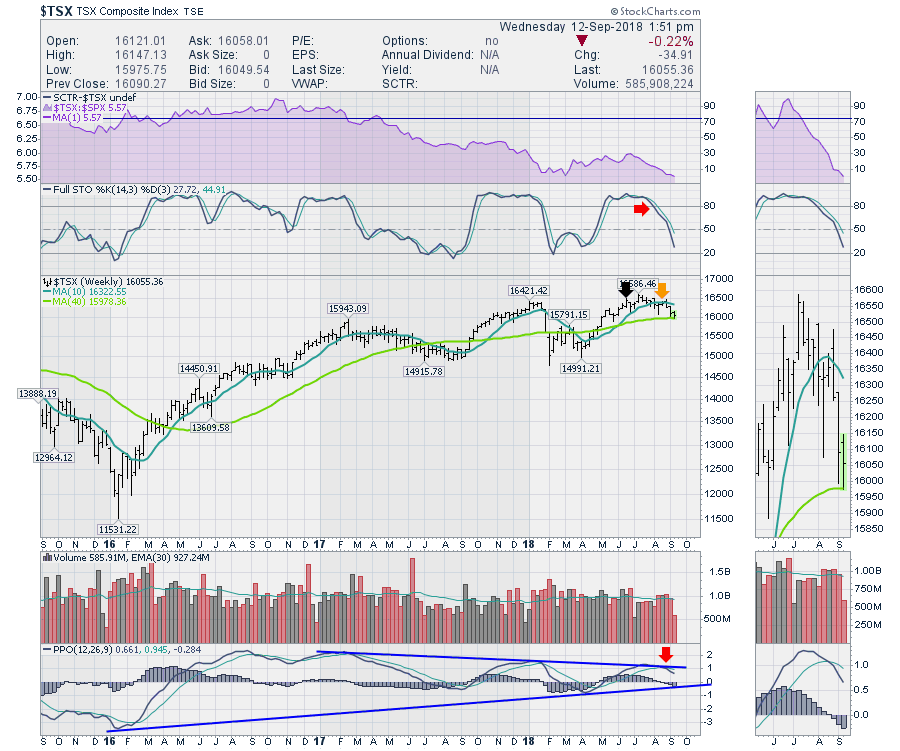 On the last Canadian Technician report, the $TSX was trying to break the back above the 10 week moving average to the right of the orange arrow. The next day the chart broke down again and has been falling since. This week it is trying to find support at the 40 week moving average. This is an important inflection point after the failed breakout. Be very cautious trading the $TSX here.
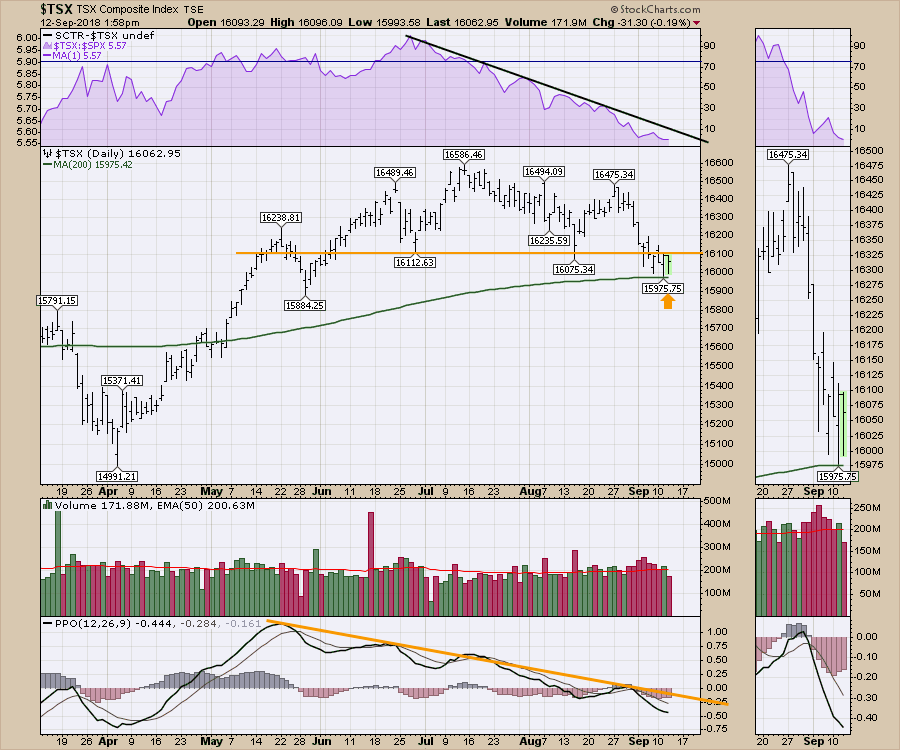
The daily chart does not have any positive divergence set up with the PPO yet. We have broken below the neck line shown in orange.
Just a note that I will be presenting at the Toronto Moneyshow on Friday September 14th at 12:45 PM. Admission is free and you can catch me at the CSTA booth all Friday afternoon. 
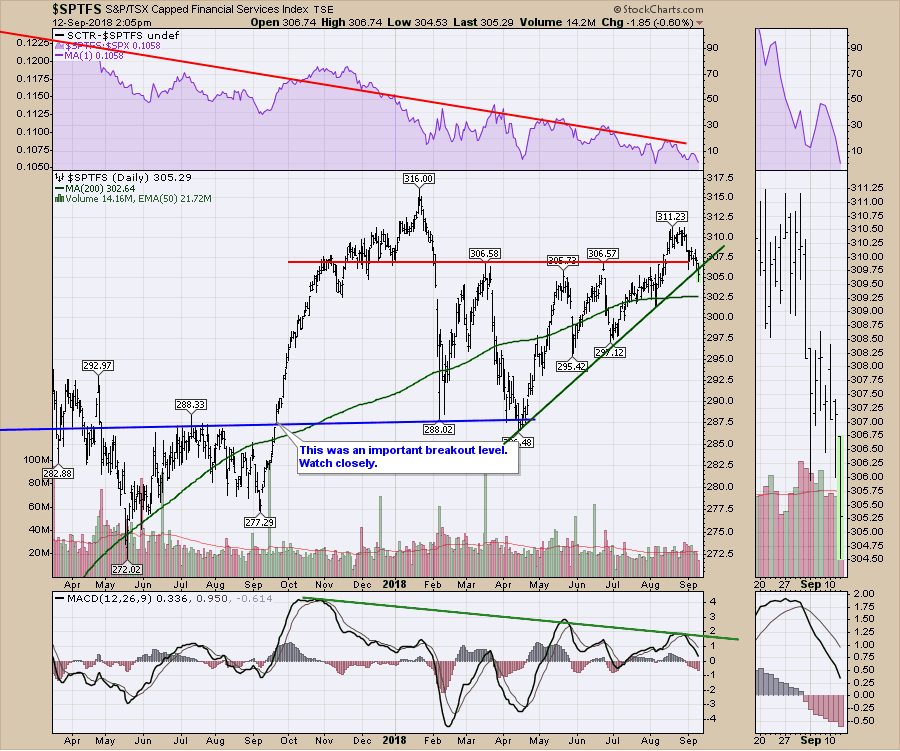
On the Canadian Technician video I mentioned the Canadian banks were susceptible to breaking the 4 month uptrend. This morning on September 12th, the financial index is breaking the uptrend. Notice the momentum trend on the MACD. Lower momentum on each surge. We can also see an uptrend in momentum from the April, July, August lows has been broken. Caution on the Canadian banks.
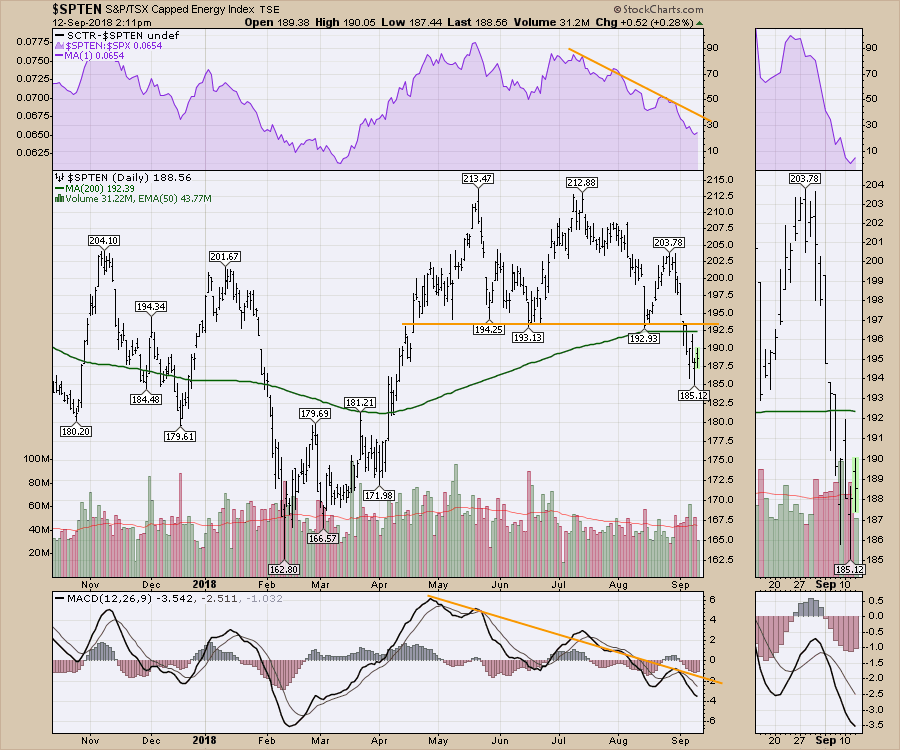
 The Energy sector is a concern as the index has moved below the 200 DMA and is trading at five month lows. It is also below a neckline on a topping pattern.
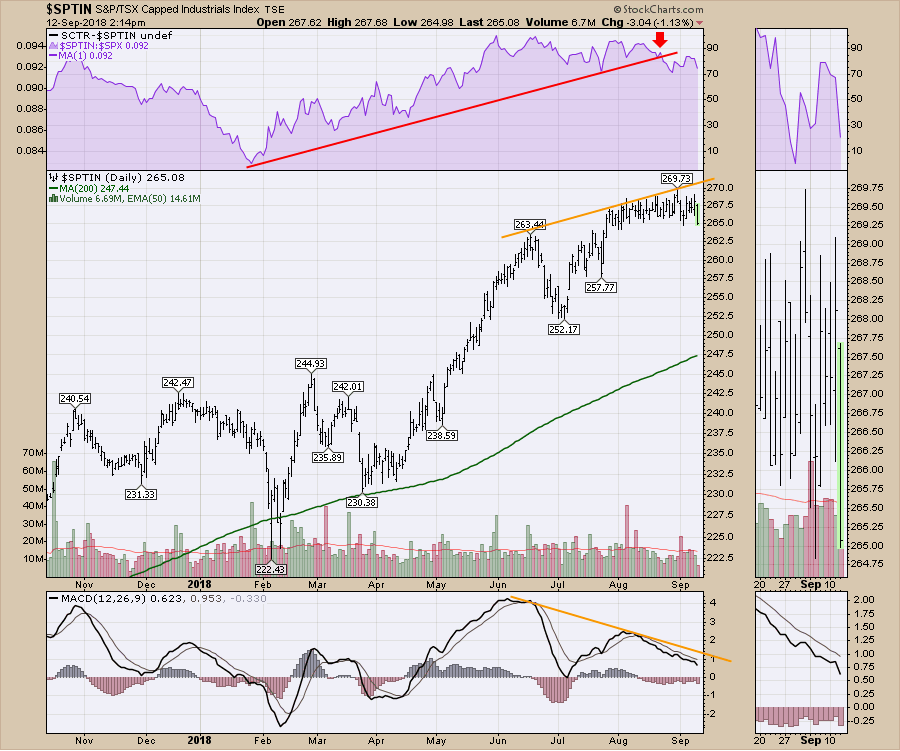
 The Industrials chart just broke its relative strength to the $SPX. This is a typical sell signal for me.
 With all of that, the Canadian market looks weak. Two weeks ago I mentioned the Marijuana stocks were soaring but might need a break. Well, the big ones like WEED.TO made a few more highs but has since pulled back and broke the uptrend. I would suggest that the main stocks in the industry are ready to pause. Check out the video.
The Canadian Technician.
Here is the Commodities countdown video for the week.
Attached are some recent videos I have posted. The Final Bar.
If you are missing intermarket signals in the market, follow me on Twitter and check out my Vimeo Channel often. Bookmark it for easy access!
Good trading,
Greg Schnell, CMT, MFTA
Senior Technical Analyst, StockCharts.com
Author, Stock Charts for Dummies
Want to read more from Greg? Be sure to follow his two StockCharts blogs:
Commodities Countdown and The Canadian Technician
