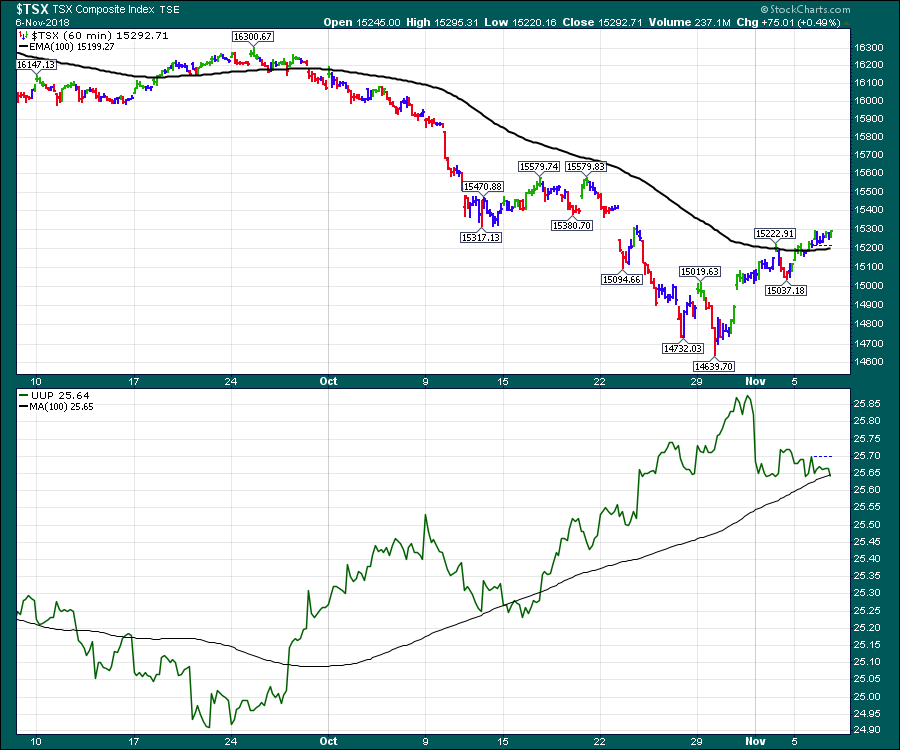
The $TSX has bounced six hundred points off of the lows. This week marks an important place on the charts. While we don't know the future, lots of previous examples suggest these current levels are zones of interest. First of all, the big downslide started as the US Dollar pushed up. Notice in late September the US Dollar popped up above this 100 period moving average. The $TSX started dropping almost in sync. Tonight's close shows the UUP sitting right on the 100 period MA and the $TSX has turned back above.
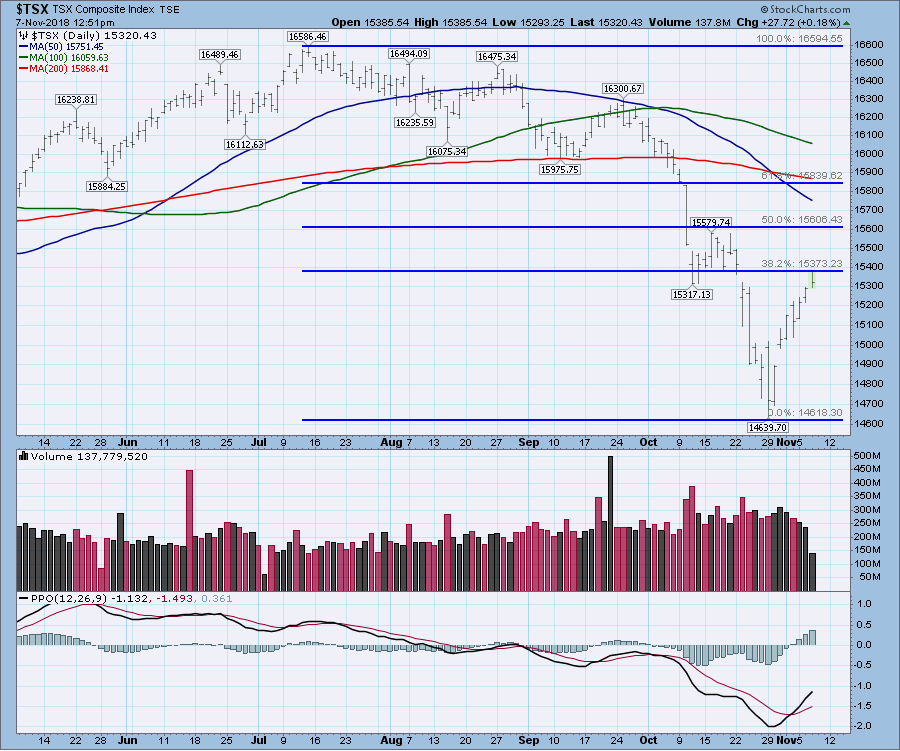
If we put fibonacci lines on the $TSX chart, there are two different places we can do that. If we use the September 25th high (not shown), we have retraced 38%. On the following chart, I have gone back to the final high in July. We can see the three major retracement levels. ranging from 15373 to 16839. Essentially a 450 point range. The $TSX is up 600 off the lows.
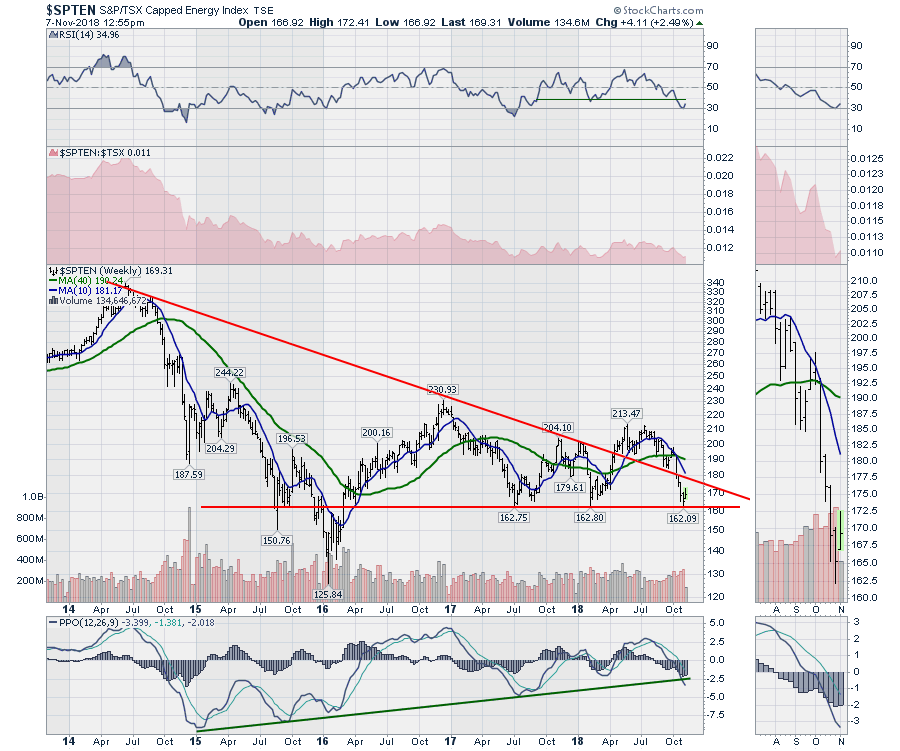
 For the Canadian sectors, Energy is about as low as we would ever want it to go, but it has been lower... The PPO breaking the 4 year trend line and pointed down does not bode well for the winter season. That said, it is reasonable to expect a solid bounce off these two year lows.
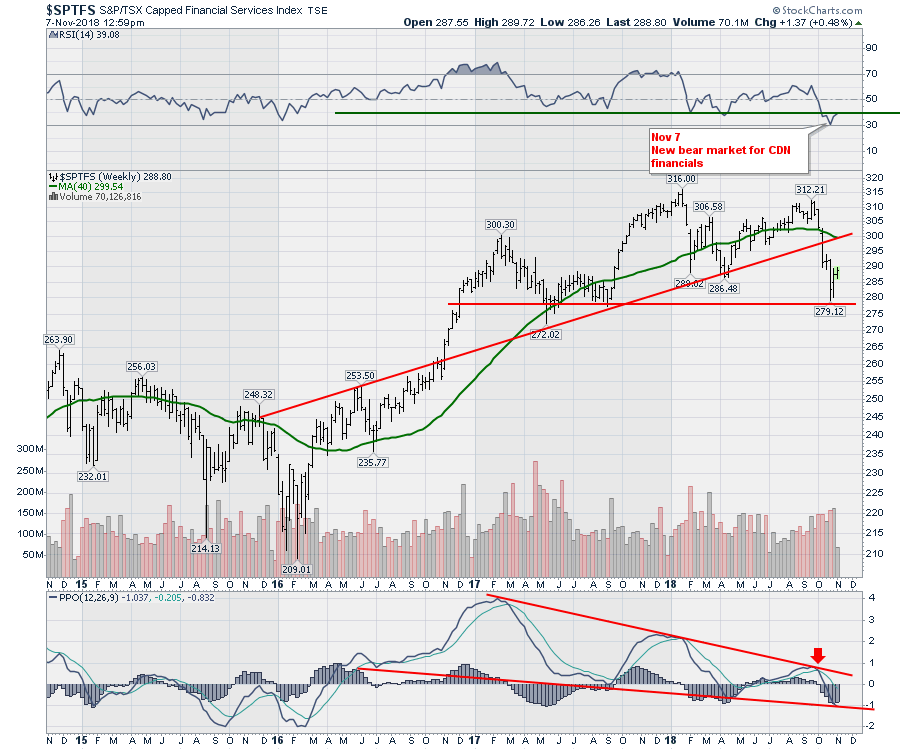
 The Canadian Financials have shown very little bounce which leads me to believe this market rolls over and pulls back. Notice I have put the new bear market flag on this chart on the RSI. That does not mean immediately lower, but this market is not getting the support it needs so sell into rallies, rather than expect new highs.
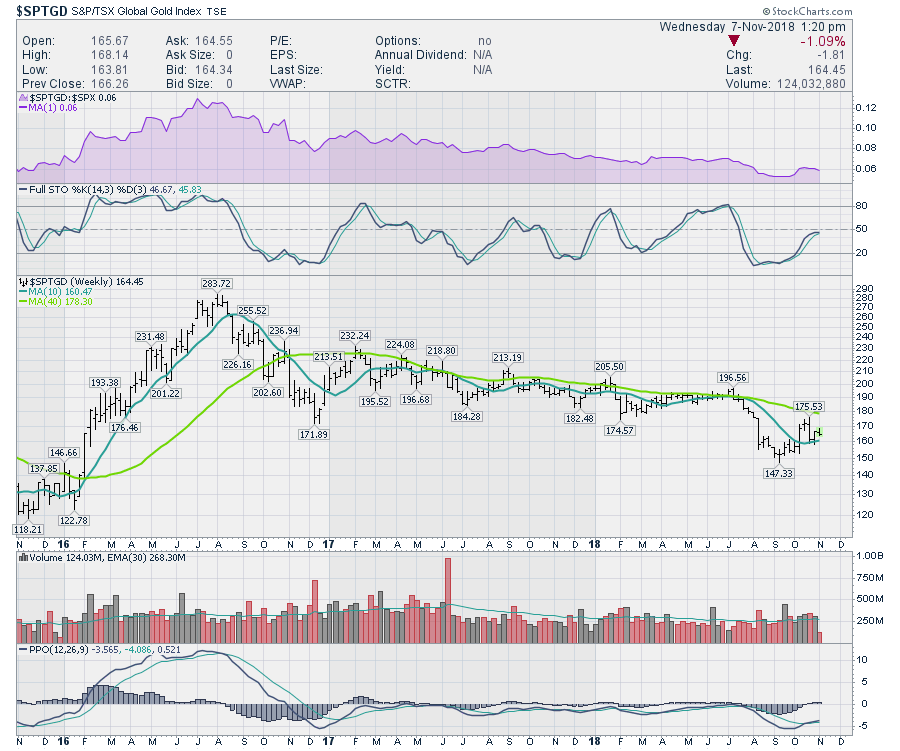
 The Gold sector still looks weak, but the PPO is turning up. This improving momentum is something to watch.
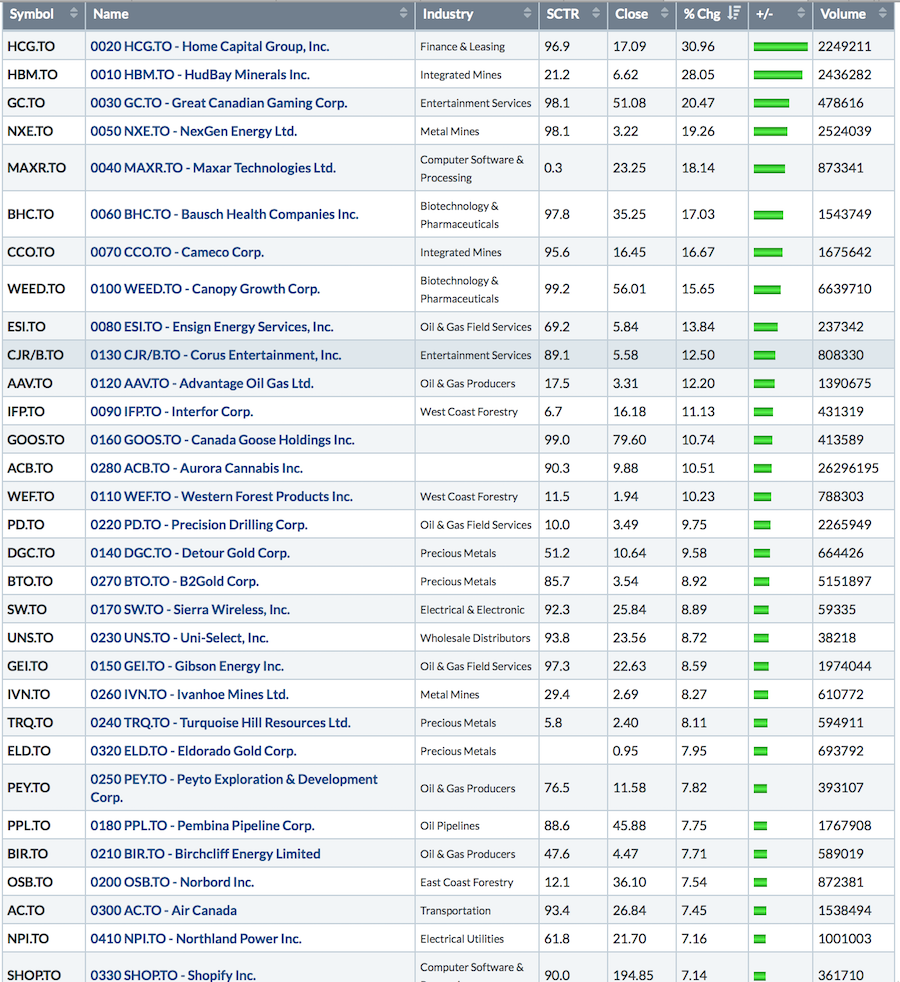
 The list of leading names from the $TSX index over the past week is very mixed. There are no clear groups. Also, some of the biggest performers have been bounces from new multi year lows. Hardly resounding buys.
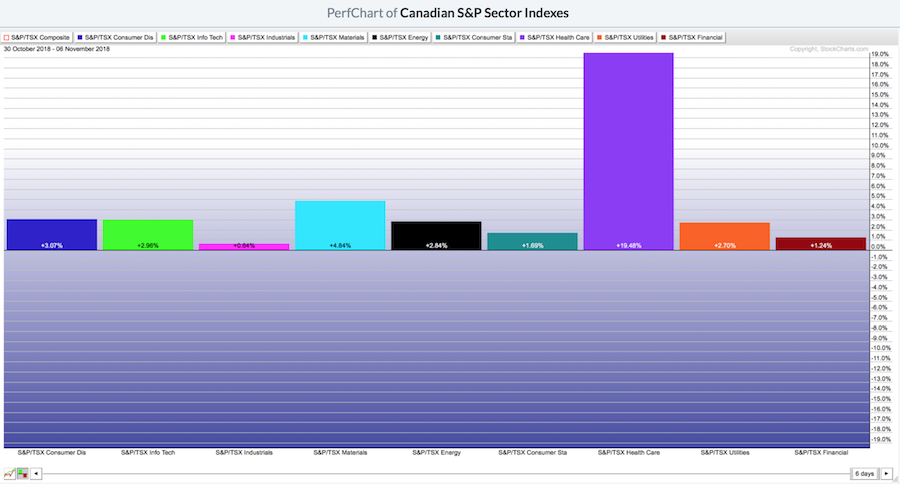
 When I look through the sectors, it is the healthcare sector that popped the most. A lot of this interest was generated by the marijuana names leading up to the US elections. With the Weed Wednesday in Canada (Oct 17) and the US Elections (November 6) out of the way, the marijuana names will need to find a new catalyst to keep the interest up in the sector.
 The biggest things to watch for over the next two weeks are overhead resistance now that the moving averages are all rolled over. So trade aggressively for fast moves, but until the moving averages develop a better slope, it is not a time to be looking for long term longs.
The Canadian Technician video shows the massive breakdown on almost every sector chart in Canada. Canada is back below the 2008 highs. Tough ten years for investors.
Here is this week's broad market review video.
This video covers off some of the recent price action around the lows.
If you are looking for a small gift, you might have family or friends that would like to learn more about the basics of charting. The first section of the book walks through all the chart settings to get the charts you want. The second section is why you might use charts for investing and the third section is putting it all together.
Click here to buy your copy today! Stock Charts For Dummies.
If you are missing intermarket signals in the market, follow me on Twitter and check out my Vimeo Channel often. Bookmark it for easy access!
Good trading,
Greg Schnell, CMT, MFTA
Senior Technical Analyst, StockCharts.com
Author, Stock Charts for Dummies
Hey, have you followed me on Twitter? Click the bird in the box below!
Want to read more from Greg? Be sure to follow his StockCharts blog:
The Canadian Technician

