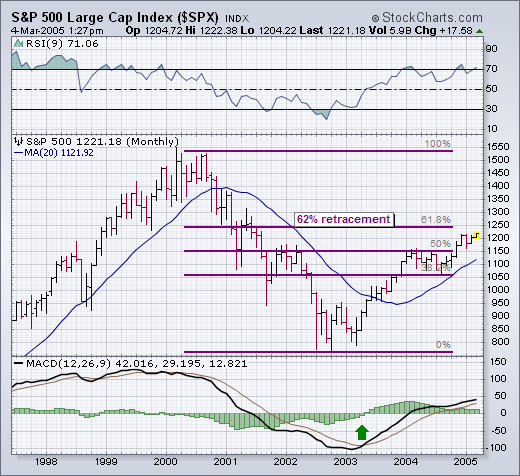
LOOKING FOR 62% RETRACEMENT AT 1250 ... With the S&P 500 having broken out of its recent trading range, and trading at the highest level in more than three years, it's time to revisit my earlier Elliott wave interpretation and came up with some possible upside price and time targets. Let's start with the monthly bars in Chart 1. As far as the technical indicators are concerned, the monthly MACD lines are still positive. The buy signal given in early 2003 is still intact. The monthly RSI line, however, is in overbought territory. That's of some concern, but doesn't prevent the market from moving higher. The question is how much higher. The horizontal lines measure the percentage retracements of the 2000-2002 bear market. The S&P has already moved above the 50% level. That makes the next upside target the 62% retracement level which sits near 1250 . There are some other technical measurements that confirm a move at least to that higher level.