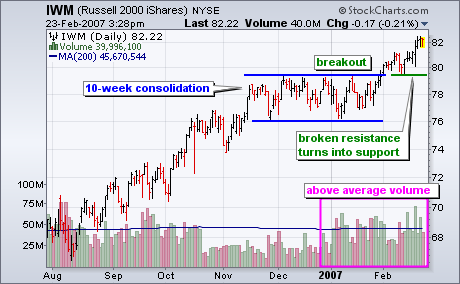
The Russell 2000 iShares (IWM) broke consolidation resistance this month and two key volume-based indicators point to strong buying pressure.
The first chart shows the Russell 2000 iShares (IWM) and volume. The ETF surged from mid August to mid November and then consolidated for 10 weeks. This consolidation represents a rest in the uptrend and the breakout signals a continuation of the uptrend. Notice that broken resistance is turning into support and the ETF is holding above broken resistance. This shows strength and a move back below the resistance breakout would be the first sign of trouble.
The next chart shows two classic volume-based indicators: On Balance Volume and the Accumulation Distribution Line. OBV is a cumulative indicator based on the close from one day to the next. Volume is added on up days and subtracted on down days. The Accumulation Distribution Line is based on the level of the close relative to the high-low range. Accumulation takes place when the close is above the midpoint of the high-low range and distribution takes place when the close is below the midpoint of the high-low range.
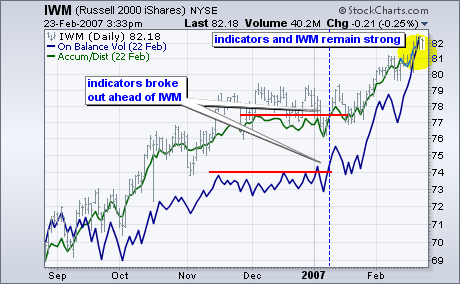
On Balance Volume (blue) and the Accumulation Distribution Line (green) show strong buying pressure and this bodes well for further strength in IWM. First, notice that both broke out ahead of IWM. The blue dotted line shows the indicator breakouts in early January. This is a few weeks earlier than IWM. Second, notice that both indicators are trading near their highs and continue strong. Buying pressure is not letting up and this points to higher prices in IWM.
