Two weeks ago I stated that a correction had begun, and that the initial selling had resulted in an initiation climax – a technical condition that indicated that the initial down pressure was probably near exhaustion, but that signaled the beginning of a new down trend. My expectation was that there was going to be a bounce (reaction rally), but that more selling would follow after that rally was finished.
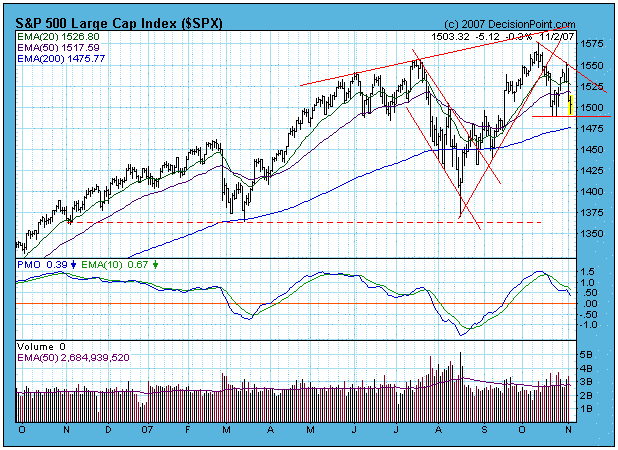
This week the rally ended and the selling resumed. It is still my opinion that the selling will probably continue into mid-December where my 9-Month Cycle projection calls for a price low for the correction. A reasonable price target for that low would be 1375 on the S&P 500 Index, but the market segments are very mixed in terms of strength, and there is not conclusive evidence that the market is just going to fall apart.
In spite of the dramatic price moves of the last several weeks, we can see on the chart below that the S&P 500 Index is only about 5% off its all-time high, and strictly speaking a declining trend has not officially been established – it needs to make a lower low.
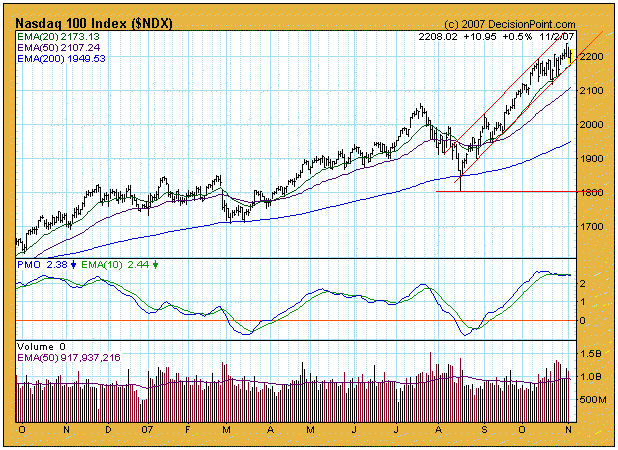
While the S&P 500 Index is slipping, the Nasdaq 100 Index remains in a rising trend and fully in the bullish mode. We can see on the chart below that it has recently failed to rise to the top of its rising trend channel, indicating some weakness; however, while a correction is virtually assured, there is no reason to expect this segment of the market to enter a bear market.
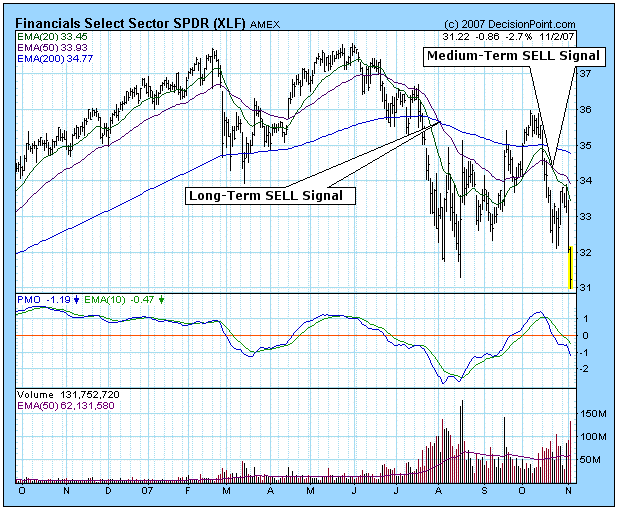
There are, however, market sectors that are officially in a bear market – Consumer Discretionary and Financials to be specific – and weakness in these sectors is the reason the S&P 500 is struggling.. The chart below is of Financials, but the Consumer Discretionary chart is very similar. Note that a long-term sell signal was generated when the 50-EMA crossed down through the 200-EMA. This signaled the beginning of a bear market for this sector. Once the bear market background had been established, a medium-term sell signal was generated the next time the 20-EMA crossed down through the 50-EMA.
Bottom Line: Technically, the condition of the market is neither overbought or oversold. This leaves room for movement in either direction; however, I am inclined to think that the correction will continue for several more weeks. While there is strength the NDX and in certain sectors, there are a few sectors that are unusually weak. It is not clear which side of the mix is going to prevail.


