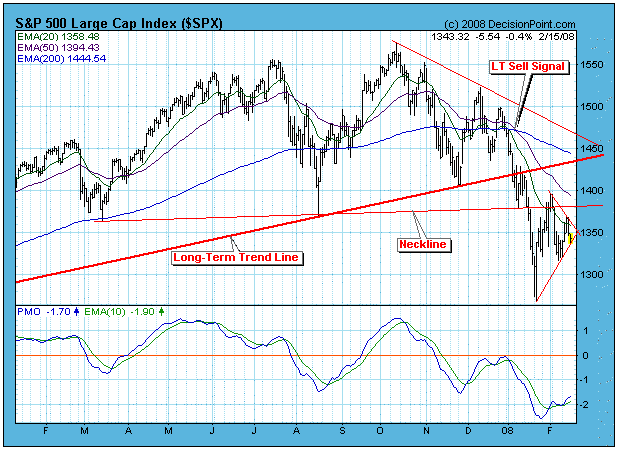
When the market began to rally this week, it looked as if a successful retest of last month's lows had occurred and that another up leg had begun; however, what looked like the start of a new rising trend, has now morphed into a triangle formation with the price index trying to break through the bottom of the triangle. While the triangle itself is a neutral formation, we are in a bear market, so the odds favor a break down from the triangle and another retest move on the January lows.

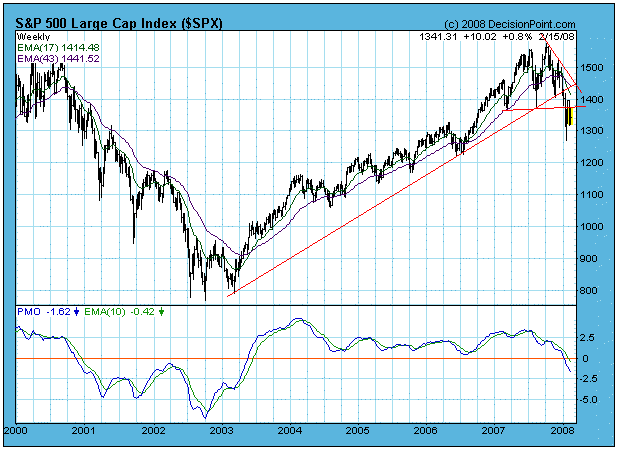
The next chart, a weekly-based chart of the S&P 500 Index, continues to confirm that we are in a bear market. There has been a moving average downside crossover, and the moving averages and PMO (Price Momentum Oscillator) continue to move downward.

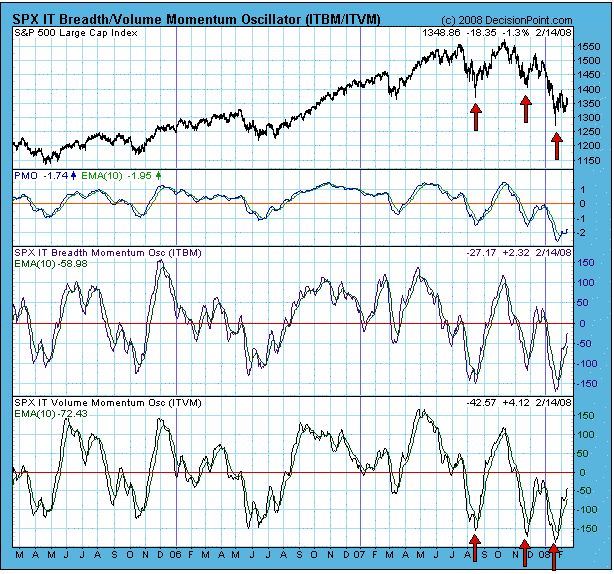
The following chart illustrates how oversold conditions in a bear market do not provide the degree of internal compression we normally see in bull markets. Note how the two most recent oversold lows on the price, breadth, and volume indicators failed to produce the kind of price gains that we see from the August 2007 lows. You can also see other examples of bull market reactions to oversold conditions on the chart.

Bottom Line: Whereas the charts had begun to look as though we had a short-term bottom in place, we are now faced with an unresolved triangle pattern in a down trend. Odds favor a downside resolution, but, even if it resolves to the upside, it is doubtful that there will be enough steam behind the rally to overcome bear market drag and penetrate major overhead resistance.
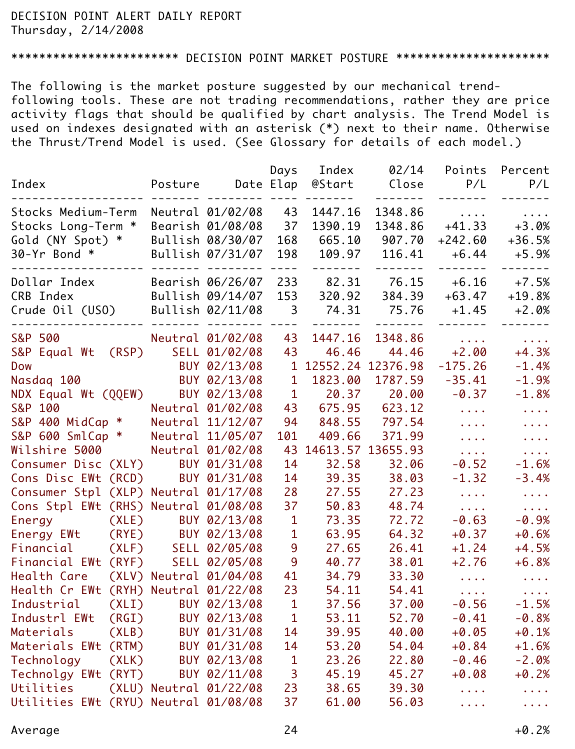
Regardless of my personal opinion, we rely on the mechanical trend models to determine our market posture. Below is a recent snapshot of our primary trend-following timing model status for the major indexes and sectors we track. Note that we have added the nine Rydex Equal Weight ETF versions of the S&P Spider Sectors. This may seem redundant, but the equal weighted indexes most often do not perform the same as their cap-weighted counterparts, and they provide a way to diversify exposure.

