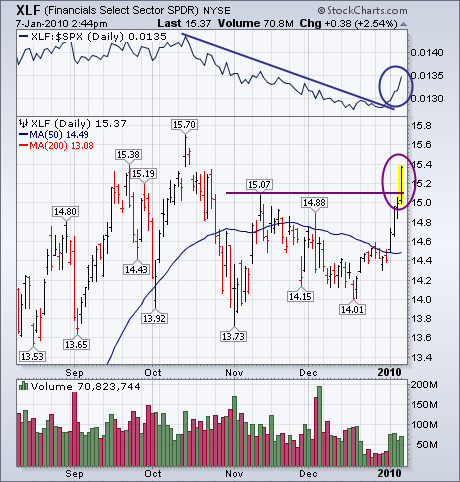
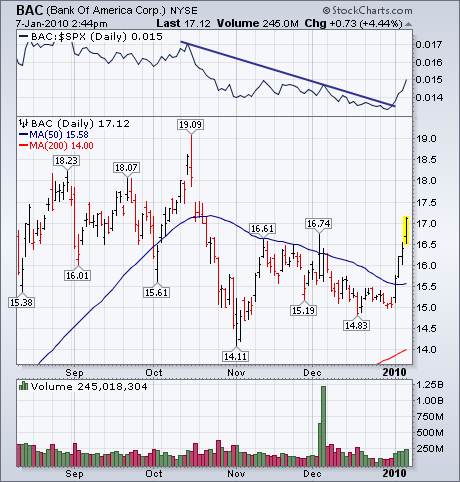
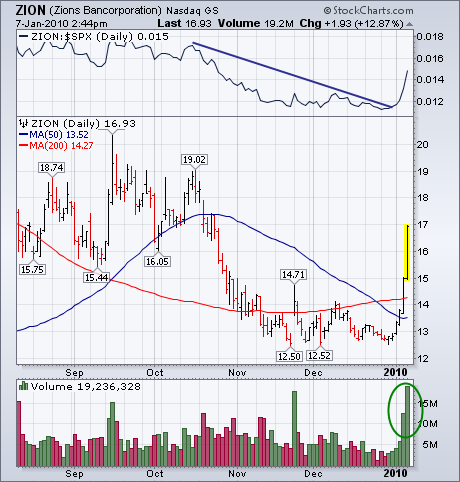
On Tuesday, I showed the financial sector in the process of turning from a market laggard into a market leader. Chart 1 shows that new financial leadership continuing. The Financials SPDR (XLF) has now exceeded its mid-November peak at 15.07 to turn its short-term trend back up again. That puts the XLF in position to challenge its October high. The upturn in its relative strength ratio (top of chart) shows financial stocks starting to outperforming the S&P 500 for the first time since mid-October. Similar bullish patterns are now visible in most financial stocks. One of the biggest, which I showed on Tuesday, is Bank Of America. Chart 2 shows that bank leader trading over 17 for the first time in nearly three months. The sector's top percentage gainer today is Zions Bancorp. Chart 3 shows that financial service company surging 12% on huge volume. That's a bullish combination. Both of those stocks are also showing rising relative strength lines. Regional banks are also having a very strong day.


